Consuming in Context

npharris-oscarsIt was interesting watching my family watch the Oscars Sunday night. Given that I’m the father of two millennials, who have paired with their own respective millennials, you can bet that it was a multi-screen affair. But to be fair, they weren’t the only ones splitting their attention amongst the TV and various mobile devices. I was also screen hopping.

As Dave Morgan pointed out last week, media usage no longer equates to media opportunity. And it’s because the nature of our engagement has changed significantly in the last decade. Unfortunately, our ad models have been unable to keep up. What is interesting is the way our consumption has evolved. Not surprisingly, technology is allowing our entertainment consumption to evolve back to its roots. We are watching our various content streams in much the same way that we interact with our world. We are consuming in context.

The old way of watching TV was very linear in nature. It was also divorced from context. We suspended engagement with our worlds so that we could focus on the flickering screen in front of us. This, of course, allowed advertisers to buy our attention in little 30-second blocks. It was the classic bait and switch technique. Get our attention with something we care about, and then slip in something the advertiser cares about.

The reason we were willing to suspend engagement with the world was that there was nothing in that world that was relevant to our current task at hand. If we were watching Three’s Company, or the Moon Landing, or a streaker running behind David Niven at the 1974 Oscar ceremony, there was nothing in our everyday world that related to any of those TV events. Nothing competed for the spotlight of our attention. We had no choice but to keep watching the TV to see what happened next.

But imagine if a nude man suddenly appeared behind Matthew McConaughey at the 2015 Oscars. We would immediately want to know more about the context of what just happened. Who was it? Why did it happen? What’s the backstory? The difference is now, we have channels at our disposal to try to find answers to those questions. Our world now includes an extended digital nervous system that allows us to gain context for the things that happen on our TV screens. And because TV no longer has exclusive control of our attention, we switch to the channel that is the best bet to find the answers we seek.

That’s how humans operate. Our lives are a constant quest to fill gaps in our knowledge and by doing so, make sense of the world around us. When we become aware of one of these gaps we immediate scan our environment to find cues of where we might find answers. Then, our senses are focused on the most promising cues. We forage for information to satiate our curiosity. A single-minded focus on one particular cue, especially one over which we have no control, is not something we evolved to do. The way we watched TV in the 60s and 70s was not natural. It was something we did because we had no option.

Our current mode of splitting attention across several screens is much closer to how humans naturally operate. We continually scan our environment, which, in this case, included various electronic interfaces to the extended virtual world, for things of interest to us. When we find one, our natural need to make sense sends us on a quest for context. As we consume, we look for this context. The diligence of our quest for that context will depend on the degree of our engagement with the task at hand. If it is slight, we’ll soon move on to the next thing. If it’s deep, we’ll dig further.

On Sunday night, the Hotchkiss family quest for context continually skipped around, looking for what other movies J.K. Simmons had acted in, watching the trailer for Whiplash, reliving the infamous Adele Dazeem moment from last year and seeing just how old Benedict Cumberbatch is (I have two daughters that are hopelessly in love, much to the chagrin of their boyfriends). As much as the advertisers on the 88th Oscars might wish otherwise, all of this was perfectly natural. Technology has finally evolved to give our brain choices in our consumption.


The Maturity Continuum of Social Media

facebook-twitter-635Social channels will come and go. Why are we still surprised by this? Just last week, Catharine Taylor talked about the ennui that’s threatening to silence Twitter. Frankly, the only thing surprising about this is that Twitter has had as long a run as they have. Let’s face it. If every there was a social media one trick pony, it’s Twitter.

The fact is, if you are a player in the social media space, you have to accept that there’s a unique maturity evolution in usage patterns. It’s a much more fickle audience than you would find in something like content publishing or search. The channels we use to express ourselves socially are subject to an extraordinary amount of irrational behavior. We project our own beliefs about who we are and how we fit into our own social networks on them. This leaves them vulnerable to sudden shifts in usage, simply because large chunks of the audience may suddenly have changed their minds about what is socially acceptable. And this is what’s currently happening to Twitter.

This is compounded by the fact that we’re talking about technology here, so where we perceive ourselves to be on the technology acceptance curve will have an impact on the social channels we find acceptable to us. If we think we’re early adopters, we’ll be quicker to move to whatever is new. Not only this, we’ll be unduly influenced by what we see other early adopters doing.

The Maturity Continuum for Social is as follows:

It’s a Fad – You use it because everyone (in your circle of influence) else is doing it. Early adopters are particularly susceptible to this effect. They’ll be the ones to test out new channels and tools, simply because they are new. But that momentum doesn’t last long. New entrants will also have to prove that they have at least a certain amount of functionality, and, more importantly, something unique that users can identify with. If this is the case, they will transition to the second phase:

It’s a Statement – You use it because it makes a statement about who you are. And with technology, it’s usually about how cutting edge you are. This makes it particularly prone to abandonment. But there are other factors at play here. Is it all business (LinkedIn) or all fun (Snapchat)? A small percentage of the user base will stick in this phase, becoming brand loyalists. The majority, however, will move on to the third phase:

It’s a Tool – You use it because it’s the best tool for the job. Here, functionality trumps all. It’s in these last two phases where rationality finally takes hold. The sheen of the BSOS (Bright Shiny Object Syndrome) has faded and we’ll only continue using it if it provides better functionality for the task at hand than any of the other alternatives. The problem here is the functional supremacy is a never-ending arms race. Sooner or later, something better will come along (if it successfully navigates through the first two phases). This is typically the end of the road for most social media one-trick ponies, and this is what is currently staring Twitter in the face.

It’s a Platform – You use it because the landscape is familiar. Here you rely on becoming a habitual “stickiness” with users and something called UI Cognitive Lock in. Essentially, this is an online real estate play. If you’ve had a long run as a single purpose tool and have developed a large user base, you have to expand that into a familiar landscape before a new contender unseats you as the tool of choice. This is what Facebook and LinkedIn are currently trying to do. And, to survive, it’s what Twitter must do as well. By assembling a number of tools, you increase the cost of switching to the point where it doesn’t make sense for most users.

Each of these phases has different usage profiles, which directly impact their respective business models. More on that next week.


The Psychology of Usefulness: A New Model for Technology Acceptance.

In the last post, I reviewed the various versions of the Technology Acceptance Model. Today, I’d like to introduce my own thoughts on the subject and a proposed new model.  But first, I’d like to introduce an entirely new model to the discussion.

Introduction of Sense Making

I like Gary Klein’s Theory of Sense Making – a lot! And in the area of technology acceptance, I think it has to be part of the discussion. It introduces a natural Bayesian rhythm to the process that I think provides a intuitive foundation for our decisions on whether or not we’ll accept a new technology.

Kleins-Data-Frame-Model-of-Sensemaking

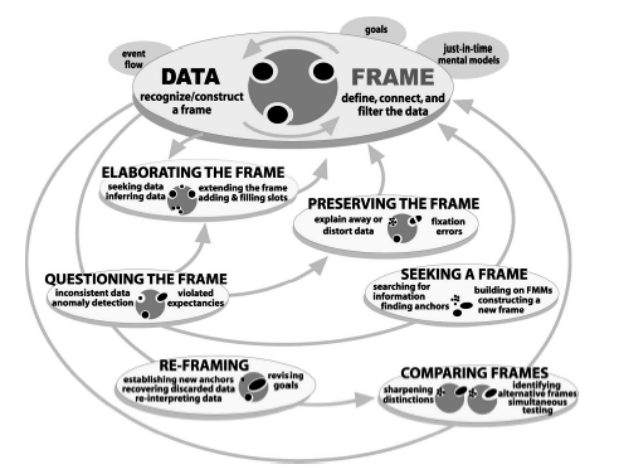
Gary Klein et al – Sensemaking Model How Might “Transformational” Technologies and Concepts be Barriers to Sensemaking in Intelligence Analysis

Essentially, the Sense Making Model says that when we try to make sense of something new, we begin with some type of perspective, belief or viewpoint. In Bayesian terms, this would be our prior. In Klein’s model, he called it a frame.

Now, this frame doesn’t only give us a context in which to absorb new data, it actually helps define what counts as data. This is a critical concept to remember, because it dramatically impacts everything that follows. Imagine, for example, that you arrive on the scene of a car accident. If your frame was that of a non-involved bystander, the data you might seek in making sense of the situation would be significantly different than if your frame was that of a person who recognized one of the vehicles involved as belonging to your next-door neighbor.

In the case of technology acceptance, this initial frame will shape what types of data we would seek in order to further qualify our decision. If we start with a primarily negative attitude, we would probably seek data that would confirm our negative bias. The opposite would be true if we were enthusiastic about the adoption of technology. For this reason, I believe the creation of this frame should be a step in any proposed acceptance model.

But Sense Making also introduces the concept of iterative reasoning. After we create our frame, we do a kind of heuristic “gap analysis” on our frame. We prod and poke to see where the weaknesses are. What are the gaps in our current knowledge? Are there inconsistencies in the frame? What is our level of conviction on our current views and attitudes? The weaker the frame, the greater our need to seek new data to strengthen it. This process happens without a lot of conscious consideration. For most of us, this testing of the frame is probably a subconscious evaluation that then creates an emotional valence that will impact future behavior. On one extreme, it could be a strongly held conviction, on the other it would be a high degree of uncertainty.

If we decide we need more data, the Sense Making Model introduces another “Go/No Go” decision point. If the new data confirms our initial frame, we elaborate that frame, making it more complete. We fill in gaps, strengthen beliefs, discard non-aligned data and update our frame. If our sense making is in support of a potential action and we seem to be heading in the right direction with our data foraging, this can be an iterative process that continually updates our frame until it’s strong enough to push us over the threshold of executing that action.

But, if the new data causes serious doubt about our initial frame, we may need to consider “reframing,” in which case we’d have to seek new frames, compare against our existing one and potentially discard it in favor of one of the new alternatives. This essentially returns us to square one, where we need to find  data to elaborate the new frame. And there the cycle starts again.

This double loop learning process illustrates that a decision process, such as accepting a new technology, can loop back on itself at any point, and may do so at several points. More than this, it is always susceptible to a “reframing” incident, where new data may cause the existing frame to be totally discarded, effectively derailing the acceptance process.

Revisiting Goal Striving

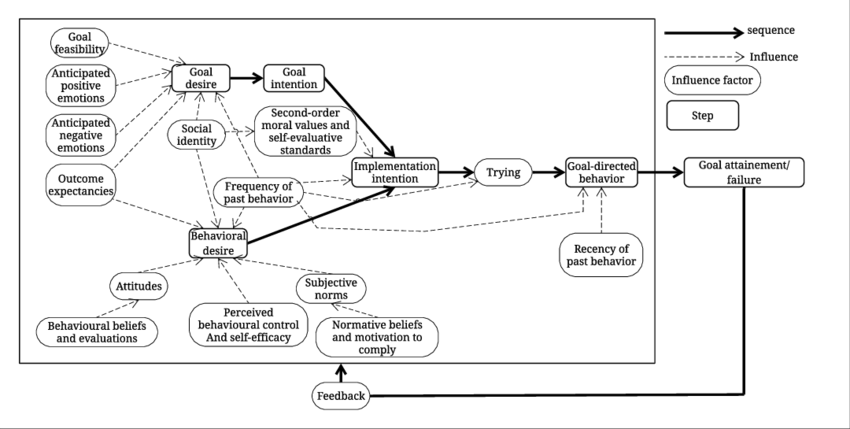
I also like Bagozzi’s Goal Striving model, for reasons outlined in a previous post. I won’t rehash them here, except to say that this model introduces a broader context that is more aligned with the complexity of our typical decision process. In this case, our desire to achieve goals is a fundamental part of the creation of the original frame, which forms the starting point for our technology acceptance decision. In this case, the Goal Desire step, at the left side of the model, could effectively be the frame that then gets updated as we move from Goal Intention to Behavioral Desire and then once again as we move to Behavioral Intention. All the inputs shown in Bagozzi’s model, shown as both external factors (ie Group Norms) and internal factors (Emotions, etc) would serve as data in either the updating or reframing loops in Klein’s model.

Bagozzis-purchasing-behavior-adoption-model

A New Model

As the final step in this rather long process I’ve been dragging you through for the last several posts, I put forward a new proposed model for technology acceptance.

Slide1

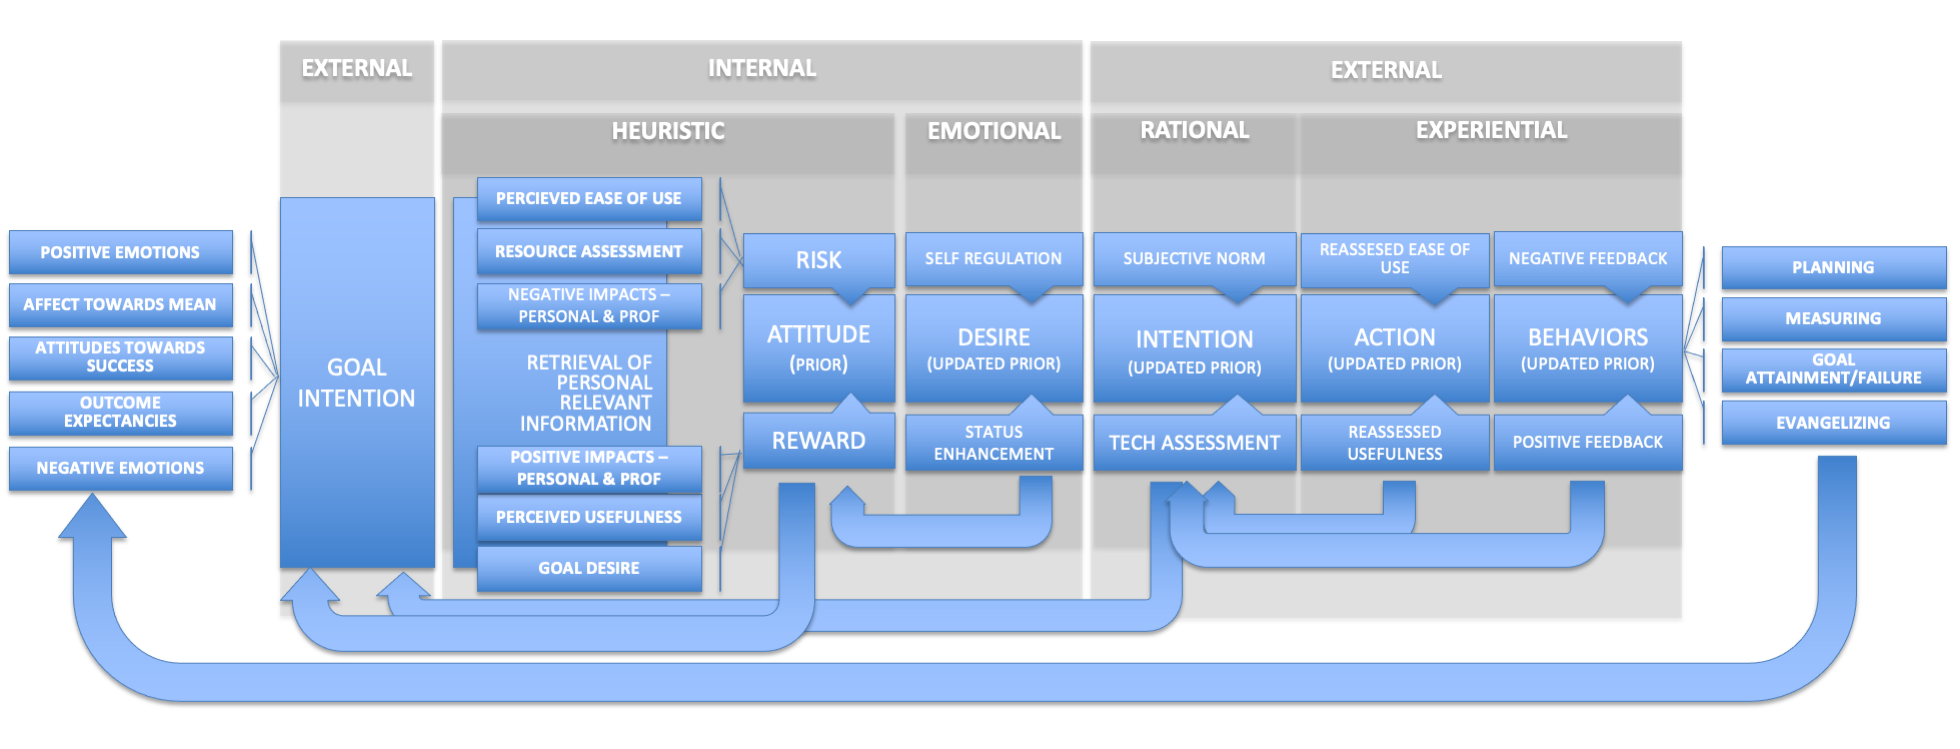
I’ve attempted to include elements of Sense Making, Goal Striving and some of the more valuable elements from the original Technology Acceptance Models. I’ve also tried to show that this in an iterative journey – a series of data gathering and consideration steps, each one of which can result in either a decision to move forward (elaborate the frame) or move backwards to a previous step (reframe a frame). The entire model is shown below, but we’ll break it down into pieces to explore each step a little more deeply.


Setting the Frame

Gord Tam 1

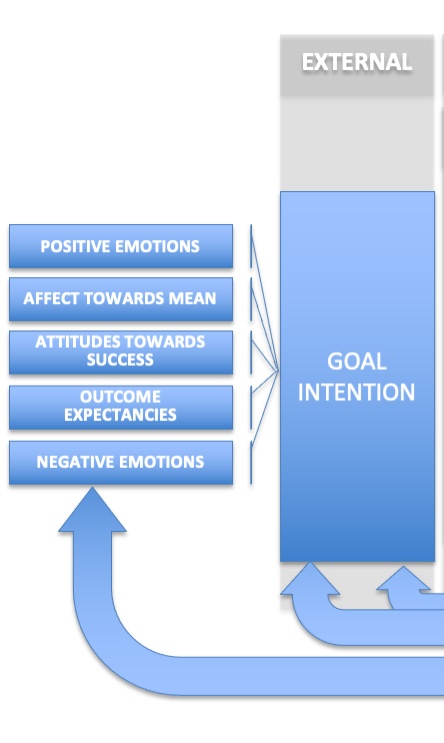
The first step is to set the original frame, which is the Goal Intention. In this case, a goal is either presented to us, or we set the goal ourselves. The setting of this goal is the trigger to establish both a cognitive and emotional frame that sets the context for everything that follows. Factors that go into the creation of the Goal Intention can include both positive and negative emotions, our attitudes towards the success of the goal, how it will impact our current situation (affect towards the mean), and what we expect as far as outcomes. These factors will determine how  robust our Goal Intention is, which will factor heavily in any subsequent decisions that are made as part of this Goal Intention, including the decision to accept or reject any relevant technologies required to execute on our Goal Intention.

We can assume, because there is not an updating step shown here, that once the Goal Intention is formed, the person will move forward to the next step – the retrieval of internal information and the creation of our attitude towards the Goal to be achieved.

The Internal Update

Gord Tam 2

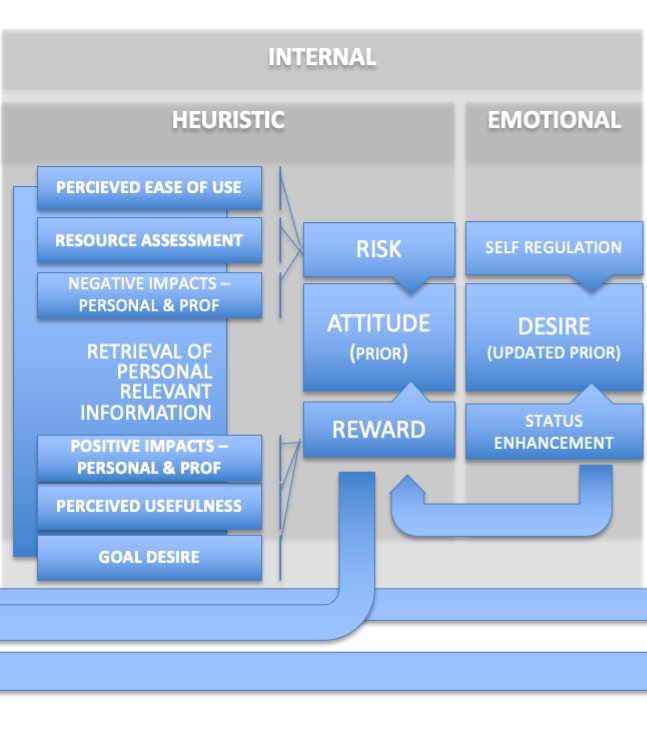
With the setting of the goal intention, we have our frame. Now, it’s up to us to update that frame. Again, our confidence in this initial frame will determine how much data we feel we need to connect to update our frame. This follows Herbert Simon’s heuristic rules of thumb for Bounded Rationality. If we’re highly confident in our frame (to the point where it’s entrenched as a belief) we’ll seek little or no data, and if we do, the data we seek will tend to be confirmatory. If we’re less confident in our frame, we’ll actively go and forage for more data, and we’ll probably be more objective in our judgement of that data. Again, remember, Klein’s Sense Making model says that our frame determines what we define as data.

The first update will be a heuristic and largely subconscious one. We’ll retrieve any relevant information from our own memory. This information, which may be positive or negative in nature, will be assembled into an “attitude” towards the technology. This is our first real conscious evaluation of the technology in question. This would be akin to a Bayesian “prior” – a starting point for subsequent evaluation. It also represents an updating of the original frame. We’ve moved from Goal Intention to a emotional judgement of the technology to be evaluated.

The creation of the “Attitude” also requires us to begin the Risk/Reward balancing, similar to Charnov’s Marginal Value Theorem used in optimal foraging. Negative items we retrieve increase risk, positive ones increase reward. The balance between the two determine our next action. From this point forward, each updating of the frame leads us to a new decision point. At this decision point, we have to decide whether we move forward (elaborate our frame) or return to an earlier point in the decision process, with the possibility that we may need to reframe at that point. Each of these represents a “friction point” in the decision process, with reward driving the process forward and risk introducing new friction. At the attitude state, excessive risk may cause us to go all the way back to reconsidering the goal intention. Does the goal as we understand it still seem like the best path forward, given the degree of risk we have now assigned to the execution of that goal?

Let’s assume we’ve decided to move forward. Now we have to take that Attitude and translate it into Desire. Desire brings social aspects into the decision. Will the adoption of the technology elevate our social status? Will it cause us to undertake actions that may not fit into the social norms of the organization, or square well with our own social ethics? These factors will have a moderating effect on our desire. Even if we agree that the technology in question may meet the goal, our desire may flag because of the social costs that go along with the adoption decision. Again, this represents a friction point, where our desire may be enough to carry us forward, or where it may not be strong enough, causing us to re-evaluate our attitude towards the technology. If we bump back to the “Attitude” stage, a sufficiently negative judgement may in turn bump us even further back to goal intention.

The External Update

Gord TAM 3

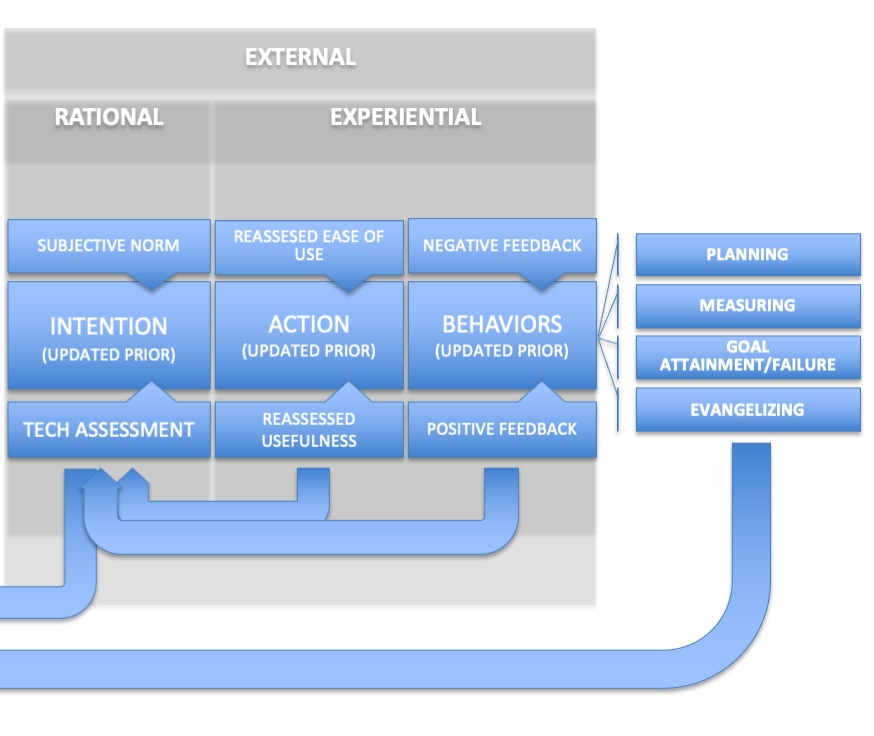
With the next stage, we’ve moved from Desire to Intention. Up to now the process has been primarily internal and also primarily either emotional or heuristic. There has been little to no rational deliberation about whether or not to accept the technology in question. The frame that has been created to this point is an emotional and attitudinal frame.

But now, assuming that this frame is open to updating with more information, the process becomes more open to external variables and also to the input of data gathered for the express purpose of rational consideration. We start openly canvassing the opinions of others (subjective norm) and evaluating the technology based on predetermined factors. In the language of marketing, this is the consumer’s “consideration” stage. We know the next step is Action – where our intention becomes translated into behavior. In the previous TAM models, this step was a foregone conclusion. Here, however, we see that it’s actually another decision friction point. If the data we gather doesn’t support our intention, action will not result. We will loop back to Goal Intention and start looking for alternatives. At the very least, this one stage may loop back on itself, resulting in iterative cycles of setting new data criteria, gathering this data and pushing towards either a “go” or “no go” decision. Only when there is sufficient forward momentum will we move to action.

Here, at the Action stage, our evaluation will rely on experiential feedback. At this point, we resurrect the concepts of “Ease of Use” and “Perceived Usefulness” from previous versions of TAM. In this case, the Intention stage would have constructed an assumed “prior” for each of these – a heuristic assessment of how easy it will be to use the technology and also the usefulness of it. This then gets compared to our actual use of the technology. If the bar of our expectations is not met, the degree of friction increases, holding us back from repeating the action, which is required to entrench it as a behavior. This will be a Charnovian balancing act. If the usefulness is sufficient, we will put up with a shortfall in the perceived ease of use. On the flip side, no matter how easy the tool is to use, if it doesn’t deliver on our expectation of usefulness, it will get rejected. Too much friction at this point will result in a loop back to the Intention stage (where we may reassess our evaluation of the technology to see if the fault lies with us or with the tool) and will possibly cause a reversion all the way to our Goal Intention.

If our experience meets our expectation, repetition will begin to create an organizational behavior. At this stage, we move from trial usage to embedding the technology into our processes. At this point, organizational feedback becomes the key evaluative criterion. Even if we love the technology, sufficient negative feedback from the organization will cause us to re-evaluation our intention. Finally, if the technology being evaluated successfully navigates past this chain of decision points without becoming derailed, it becomes entrenched. We then evaluate if it successfully plays its part in our attainment of our goals. This brings up full circle, back to the beginning of the process.

Summing Up

The original goal of the Technology Acceptance Model was to provide a testable model to predict adoption. My goal is somewhat different, showing Technology Adoption as a series of Sense Making and Goal Attainment decisions, each offering the opportunity to move forward to the next stage or loop back to a previous stage. In extreme cases, it may result in outright rejection of the technology. As far as testing for predictability, this is not the parsimonious model envisioned by Venkatesh, but then again, I suspect parsimony was sacrificed even by the Venkatesh and contributing authors somewhere between the multiple revisions that were offered.

This is a model of Bayesian decision making, and I believe it could be applied to many considered decision scenarios. One could map most higher end consumer purchases on the same decision path. The value of the model is in understanding each stage of the decision path and the factors that both introduce risk related friction and reward related momentum. Ideally, it would be fascinating to start to identify representative risk/reward thresholds at each point, so factors can be rebalanced to achieve a successful outcome.

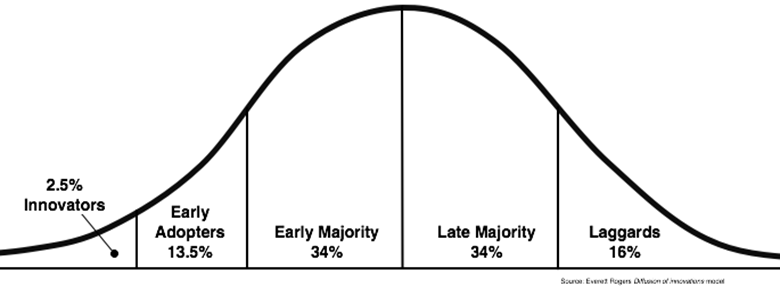
As we talk about the friction in these decision points, it’s also important to remember that we will all have different set points about how we balance risk and reward. When it comes to technology acceptance, our set point will determine where we fall on Everett Roger’s Diffusion of Technology distribution curve.


Those with a high tolerance for risk and an enhanced ability to envision reward will fall to the far left of the curve, either as Innovators or Early Adopters. Rogers noted in The Diffusion of Innovation:

Innovators may…possess a type of mental ability that better enables them to cope with uncertainty and to deal with abstractions. An innovator must be able to conceptualize relatively abstract information about innovations and apply this new information to his or her own situation

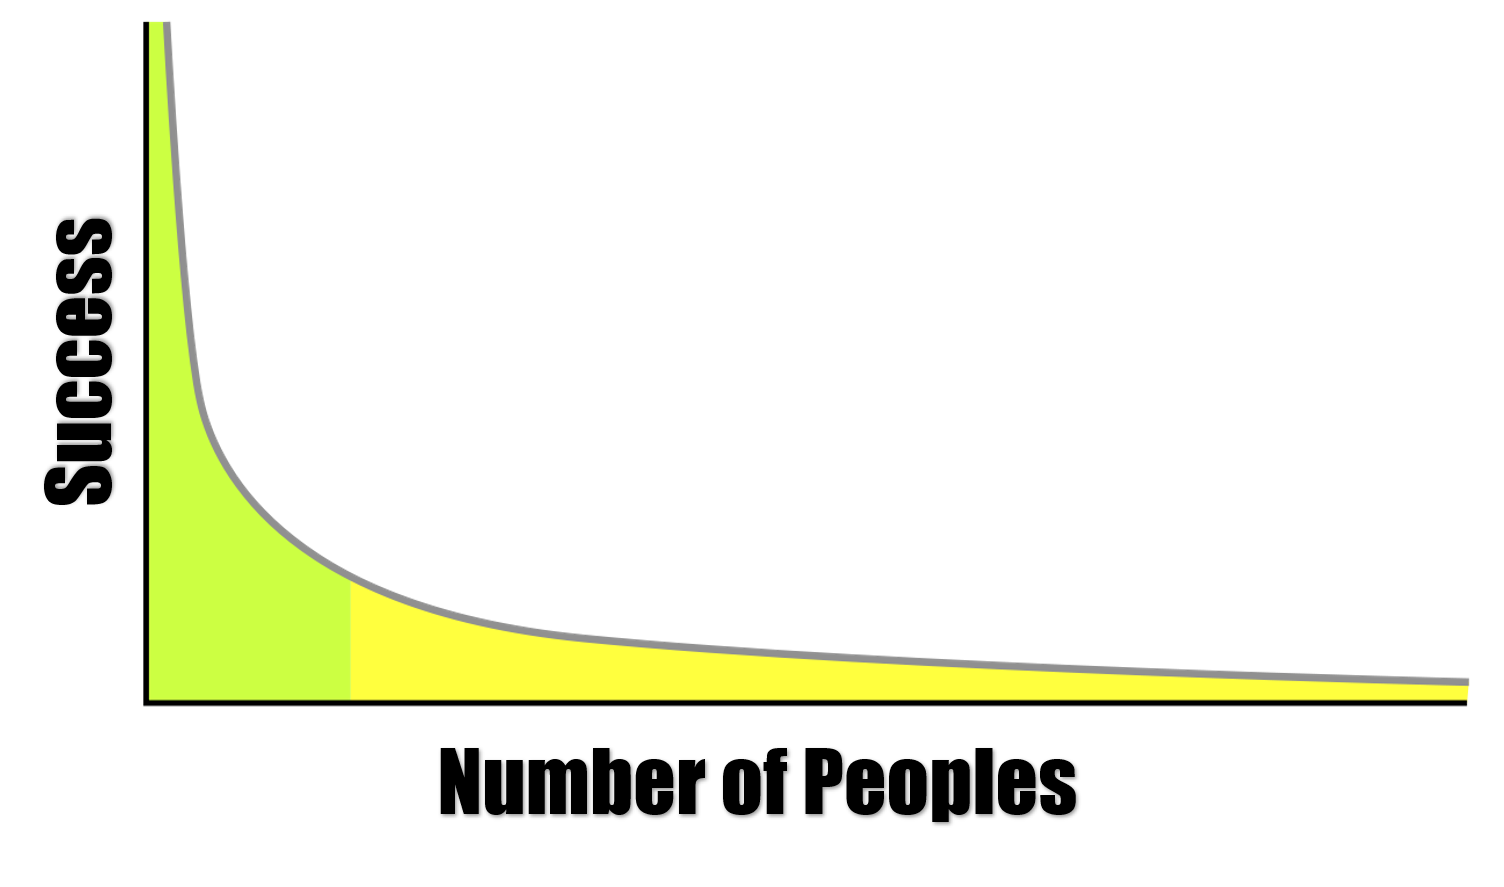
Those with a low tolerance for risk and an inability to envision rewards will be to the far right, falling into the Laggard category. The rest of us, representing 68% of the general population, will fall  somewhere in between. So, in trying to predict the acceptance of any particular technology, it will be important to assess the innovativeness of the individual making the decision.

This hypothetical model represents a culmination of the behaviors I’ve observed in many B2B adoption decisions. I’ve always stressed the importance of understanding the risk/reward balance of your target customers. I’ve also mapped out how this can vary from role to role in organizational acceptance decisions.

This post, which is currently pushing 3000 words, is lengthy enough for today. In the next post, I’ll revisit what this new model might mean for our evaluation of usefulness and subsequent user loyalty.

The Psychology of Usefulness: How Online Habits are Broken

google-searchLast post, I talked about how Google became a habit – Google being the most extreme case of online loyalty based on functionality I could think of. But here’s the thing with functionally based loyalty – it’s very fickle. In the last post I explained how Charnov’s Marginal Value Theorem dictates how long animals spend foraging in a patch before moving on to the next one. I suspect the same principles apply to our judging of usefulness. We only stay loyal to functionality as long as we believe there are no more functional alternatives available to us for an acceptable investment of effort. If that functionality has become automated in the form of a habit, we may stick with it a little longer, simply because it takes our rational brain awhile to figure out there may be better options, but sooner or later it will blow the whistle and we’ll start exploring our options. Charnov’s internal algorithm will tell us it’s time to move on to the next functional “patch.”

Habits break down when there’s a shift if one of the three prerequisites: frequency, stability or acceptable outcomes.

If we stop doing something on a frequent basis, the habit will slowly decay. But because habits tend to be stored at the limbic level (in the basal ganglia), they prove to be remarkably durable. There’s a reason we say old habits die hard. Even after a long hiatus we find that habits can easily kick back in. Reduction of frequency is probably the least effective way to break a habit.

A more common cause of habitual disruption is a change in stability. Suddenly, if something significant changes in our task environment, our  “habit scripts” start running into obstacles. Think about the last time you did a significant upgrade to a program or application you use all the time. If menu options or paths to common functions change, you find yourself constantly getting frustrated because things aren’t where you expect them to be. Your habit scripts aren’t working for you anymore and you are being forced to think. That feeling of frustration is how the brain protects habits and shows how powerful our neural energy saving mode is. But, even if the task environment becomes unstable for a time, chances are the instability is temporary. The brain will soon reset its habits and we’ll be back plugging subconsciously away at our tasks. Instability does break a habit, but it just rebuilds a new one to take its place.

A more permanent form of habit disruption comes when outcomes are no longer acceptable. The brain hates these types of disruptions, because it knows that finding an alternative could require a significant investment of effort. It basically puts us back at square one. The amount of investment required is dependent on a number of things, including the scope of change required (is it just one aspect of a multi-step task or the entire procedure?), current awareness of acceptable alternatives (is a better solution near at hand or do we have to find it?), the learning curve involved (how different is the alternative from what we’re used to using), are there other adoption requirements (do we have to make an investment of resources – including time and/or money?) and how much down time will be involved in order to adopt the alternative. All these questions are the complexities that can be factors in the Marginal Value Theorem.

Now, let’s look at how each of these potential habit breakers applies to Google. First of all, frequency probably won’t be a factor because we will search more, not less, in the future.

Stability may be a more likely cause. The fact is, the act of online searching hasn’t really changed that much in the last 20 years. We still type in a query and get a list of results. If you look at Google circa 1998, it looks a little clunky and amateurish next to today’s results page, but given that 16 years have come and gone, the biggest surprise is that the search interface hasn’t changed more than it has.

Google now and then

A big reason for this is to maintain stability in the interface, so habits aren’t disrupted. The search page relies on ease of information foraging, so it’s probably the most tested piece of online real estate in history. Every pixel of what you see on Google, and, to a lesser extent, it’s competitors, has been exhaustively tested.

That has been true in the past but because of the third factor, acceptability of outcomes, it’s not likely to remain true in the future. We are now in the age of the app. Searching used to be a discrete function that was just one step of many required to complete a task. We were content to go to a search engine, retrieve information and then use that information elsewhere with other tools or applications. In our minds, we had separate chunks of online functionality that we would assemble as required to meet our end goal.

Let me give you an example. Let’s imagine we’re going to London for a vacation. In order to complete the end goal – booking flights, hotels and whatever else is required – we know we will probably have to go to many different travel sites, look up different types of information and undertake a number of actions. We expect that this will be the best path to take to our end goal. Each chunk of this “master task” may in turn be broken down into separate sub tasks. Along the way, we’ll be relying on those tools that we’re aware of and a number of stored procedures that have proven successful in the past. At the sub-task level, it’s entirely possible that some of those actions have been encoded as habits. For an example of how these tasks and stored procedures would play out in a typical search, see my previous post, A Cognitive Walkthrough of Searching.

But we have to remember that the only reason the brain is willing to go to all this work is that it believes it’s the most efficient route available to it. If there were a better alternative that would produce an acceptable outcome, the brain would take it. Our expectation of what an acceptable outcome would be would be altered, and our Marginal Value algorithm would be reset.

Up to now, functionality and information didn’t intersect too often online. There were places we went to get information, and there were places we went to do things. But from this point forward, expect those two aspects of online to overlap more and more often. Apps will retrieve information and integrate it with usefulness. The travel aggregator sites like Kayak and Expedia are an early example of this. They retrieve pricing information from vendors, user content from review sites and even some destination related information from travel sites. This ups the game in terms of what we expect from online functionality when we book a trip. Our expectation has been reset because Kayak offers a more efficient way to book travel than using search engines and independent vendor sites. That’s why we don’t immediately go to Google when we’re planning a trip.

Let’s fast-forward a few years to see how our expectations could be reset in the future. I suspect we’re not too far away from having an app where our travel preferences have been preset. This proposed app would know how we like to travel and the things we like to do when we’re on vacation. It would know the types of restaurants we like, the attractions we visit, the activities we typically do, the types of accommodation we tend to book, etc.  It would also know the sources we tend to use when qualifying our options (i.e. TripAdvisor). If we had such an app, we would simply put in the bare details of our proposed trip: departure and return dates, proposed destinations and an approximate itinerary. It would then go and assemble suggestions based on our preferences, all in one location. Booking would require a simple click, because our payment and personal information would be stored in the app. There would be no discrete steps, no hopping back and forth between sites, no cutting and pasting of information, no filling out forms with the same information multiple times. After confirmation, the entire trip and all required information would be made available on your mobile device.  And even after the initial booking, the app would continue to comb the internet for new suggestions, reviews or events that you might be interested in attending.

This “mega-app” would take the best of Kayak, TripAdvisor, Yelp, TripIt and many other sites and combine it all in one place. If you love travel as much as I do, you couldn’t wait to get your hands on such an app. And the minute you did, your brain would have reset it’s idea of what an acceptable outcome would be. There would be a cascade of broken habits and discarded procedures.

This integration of functionality and information foraging is where the web will go next. Over the next 10 years, usefulness will become the new benchmark for online loyalty. As this happens, our expectation set points will be changed over and over again. And this, more than anything, will be what impacts user loyalty in the future. This changing of expectations is the single biggest threat that Google faces.

In the next post I’ll look at what happens when our expectations get reset and we have to look at adopting a new technology.

The Psychology of Usefulness: How We Made Google a Habit

In the last two posts, I looked first at the difference between autotelic and exotelic activities, then how our brain judges the promise of usefulness. In today’s post, I want to return to the original question: How does this impact user loyalty? As we use more and more apps and destinations that rely on advertising for their revenues, this question becomes more critical for those apps and destinations.

The obvious example here is search engines, the original functional destination. Google is the king of search, but also the company most reliant on these ads. For Google, user loyalty is the difference between life and death. In 2012, Google made a shade over 50 billion dollars (give or take a few hundred million). Of this, over $43 billion came from advertising revenue (about 86%) and of that revenue, 62% came from Google’s own search destinations. That a big chunk of revenue to come from one place, so user loyalty is something that Google is paying pretty close attention to.

Now, let’s look at how durable that hold Google has on our brains is. Let’s revisit the evaluation cascade that happens in our brain each time we contemplate a task:

  • If very familiar and highly stable, we do it by habit
  • If fairly familiar but less stable, we do it by a memorized procedure with some conscious guidance
  • If new and unfamiliar, we forage for alternatives by balance effort required against

Not surprisingly, the more our brain has to be involved in judging usefulness, the less loyal we are. If you can become a habit, you are rewarded with a fairly high degree of loyalty. Luckily for Google, they fall into this category – for now. Let’s look at little more at how Google became a habit and what might have to happen for us to break this habit.

Habits depend on three things: high repetition, a stable execution environment and consistently acceptable outcomes. Google was fortunate enough to have all three factors present.

First – repetition. How many times a day do you use a search engine? For me, it’s probably somewhere between 10 and 20 times per day. And usage of search is increasing. We search more now than we did 5 years ago. If you do something that often throughout the day it wouldn’t make much sense to force your brain to actively think it’s way through that task each and every time – especially if the steps required to complete that task don’t really change that much. So, the brain, which is always looking for ways to save energy, records a “habit script” (or, to use the terminology of Ann Graybiel – “chunks”) that can play out without a lot of guidance. Searching definitely meets the requirements for the first step of forming a habit.

Second – stability. How many search engines do you use? If you’re like the majority of North Americans, you probably use Google for almost all your searches.  This introduces what we would call a stable environment. You know where to go, you know how to use it and you know how to use the output. There is a reason why Google is very cautious about changing their layout and only do so after a lot of testing. What you expect and what you get shouldn’t be too far apart. If it is, it’s called disruptive, and disruption breaks habits. This is the last thing that Google wants.

Third – acceptable outcomes. So, if stability preserves habits, why would Google change anything? Why doesn’t Google’s search experience look exactly like it did in 1998 (fun fact – if you search Google for “Google in 1998” it will show you exactly what the results page looked like)? That would truly be stable, which should keep those all important habits glued in place. Well, because expectations change. Here’s the thing about expected utility – which I talked about in the last post. Expected utility doesn’t go away when we form a habit, it just moves downstream in the process. When we do a task for the first time, or in an unstable environment, expected utility precedes our choice of alternatives. When a “habit script” or “chunk” plays out, we still need to do a quick assessment of whether we got what we expected. Habits only stay in place if the “habit script” passes this test. If we searched for “Las Vegas hotels” and Google returned results for Russian borscht, that habit wouldn’t last very long.  So, Google constantly has to maintain this delicate balance – meeting expectations without disrupting the user’s experience too much. And expectations are constantly changing.

Internet adoption over time chartWhen Google was introduced in 1998, it created a perfect storm of habit building potential. The introduction coincided with a dramatic uptick in adoption of the internet and usage of web search in particular.  In 1998, 36% of American adults were using the Internet (according to PEW). In 2000, that had climbed to 46% and by 2001 that was up to 59%. More of us were going online, and if we were going online we were also searching.  The average searches per day on Google exploded from under 10,000 in 1998 to 60 million in 2000 and 1.2 billion in 2007. Obviously, we were searching  – a lot – so the frequency of task prerequisite was well in hand.

Now – stability. In the early days of the Internet, there was little stability in our search patterns. We tended to bounce back and forth between a number of different search engines. In fact, the search engines themselves encouraged this by providing “Try your search on…” links for their competitors (an example from Google’s original page is shown below). Because our search tasks were on a number of different engines, there was no environmental stability, so no chance for the creation of a true task. The best our brains could do at this point was store a procedure that required a fair amount of conscious oversight (choosing engines and evaluating outcomes). Stability was further eroded by the fact that some engines were better at some types of searches than others. Some, like Infoseek, were better for timely searches due to their fast indexing cycles and large indexes. Some, like Yahoo, were better at canonical searches that benefited from a hierarchal directory approach. When searching in the pre-Google days, we tended to match our choice of engine to the search we were doing. This required a fairly significant degree of rational neural processing on our part, precluding the formation of a habit.

Googlebottompage1998

But Google’s use of PageRank changed the search ballgame dramatically. Their new way of determining relevancy rankings was consistently better for all types of searches than any of their competitors. As we started to use Google for more types of searches because of their superior results, we stopped using their competitors. This finally created the stability required for habit formation.

Finally, acceptable outcomes. As mentioned above, Google came out of the gate with outcomes that generally exceeded our expectations, set by the spotty results of their competitors. Now, all Google had to do to keep the newly formed habit in place was to continue to meet the user’s expectations of relevancy. Thanks to truly disruptive leap Google took with the introduction of PageRank, they had a huge advantage when it came to search results quality. Google has also done an admirable job of maintaining that quality over the past 15 years. While the gap has narrowed significantly (today, one could argue that Bing comes close on many searches and may even have a slight advantage on certain types of searches) Google has never seriously undershot the user’s expectations when it comes to providing relevant search results. Therefore, Google has never given us a reason to break our habits. This has resulted in a market share that has hovered over 60% for several years now.

When it comes to online loyalty, it’s hard to beat Google’s death grip on search traffic. But, that grip may start to loosen in the near future. In my next post, I’ll look the conditions that can break habitual loyalty, again using Google as an example. I’ll also look at how our brains decide to accept or reject new useful technologies.

The Psychology of Usefulness: How Our Brains Judge What is Useful

To-Do-ListDid you know that “task” and “tax” have the same linguistic roots? They both come from the Latin “taxare” – meaning to appraise. This could explain the lack of enthusiasm we have for both.

Tasks are what I referred to in the last post as an exotelic activity – something we have to do to reach an objective that carries no inherent reward. We do them because we have to do them, not because we want to do them.

When we undertake a task, we want to find the most efficient way to get it done. Usefulness becomes a key criterion. And when we judge usefulness, there are some time-tested procedures the brain uses.

Stored Procedures and Habits

The first question our brain asks when undertaking a task is – have we done this before? Let’s first deal with what happens if the answer is yes:

If we’ve done something before our brains – very quickly and at a subconscious level – asks a number of qualifying questions:

–       How often have we done this?

–       Does the context in which the task plays out remain fairly consistent (i.e. are we dealing with a stable environment)?

–       How successful have we been in carrying out this task in the past

If we’ve done a task a number of times in a stable environment with successful outcomes, it’s probably become a habit. The habit chunk is retrieved from the basal ganglia and plays out without much in the way of rational mediation. Our brain handles the task on autopilot.

If we have less familiarity with the task, or if there’s less stability in the environment, but have done it before we probably have stored procedures, which are set procedural alternatives. These require more in the way of conscious guidance and often have decision points where we have to determine what we do next, based on the results of the previous action.

If we’re entering new territory and can’t draw on past experience, our brains have to get ready to go to work. This is the route least preferred by our brain. It only goes here when there’s no alternative.

Judging Expected Utility and Perceived Risk

If a task requires us to go into unfamiliar territory, there are new routines that the brain must perform. Basically, the brain must place a mental bet on the best path to take, balancing a prediction of a satisfactory outcome against the resources required to complete the task. Psychologists call this “Expected Utility.”

Expected Utility is the brain’s attempt to forecast scenarios that require the balancing of risks and rewards where the outcomes are not known.  The amount of processing invested by the brain is usually tied to the size of the potential risk and reward. Low risk/reward scenarios require less rationalization. The brain drives this balance by using either positive or negative emotional valences, interpreted by us as either anticipation or anxiety. Our emotional balance correlates with the degree of risk or reward.

Expected utility is more commonly applied in financial decision and game theory. In the case of conducting a task, there is usually no monetary element to risk and reward. What we’re risking is our own resources – time and effort. Because these are long established evolved resources, it’s reasonable to assume that we have developed subconscious routines to determine how much effort to expend in return for a possible gain. This would mean that these cognitive evaluations and calculations may happen at a largely subconscious level, or at least, more subconscious than the processing that would happen in evaluating financial gambles or those involving higher degrees of risk and reward.  In that context, it might make sense to look at how we approach another required task – finding food.

Optimal Foraging and Marginal Value

Where we balance gain against expenditure of time and effort, the brain has some highly evolved routines that have developed over our history. The oldest of these would be how we forage for food. But, we also have a knack of borrowing strategies developed for other purposes and using them in new situations.

Pirolli and Card (1999) found, for instance, that we use our food foraging strategies to navigate digital information. Like food, information online tends to be “patchy” and of varying value to us. Often, just like looking for a food source, we have to forage for information by judging the quality of hyperlinks that may take us to those information sources or “patches.” Pirolli and Card called these clues to the quality of information that may lie on the other end of links information scent.

Cartoon_foraging_theoryTied with this foraging strategy is the concept of Marginal Value.  This was first proposed by Eric Charnov in 1976 as a evolved strategy for determining how much time to spend in a food patch before deciding to move on. In a situation with diminishing returns (ie depleted food supplies) the brain must balance effort expended against return. If you happen on a berry bush in the wild, with a reasonable certainty that there are other bushes nearby (perhaps you can see them just a few steps away) you have to mentally solve the following equation – how many berries can be gathered with a reasonable expenditure of effort vs. how much effort would it take to walk to the next bush and how many berries would be available there?

This is somewhat analogous to information foraging, with one key difference. Information isn’t depleted as you consume it. So the rule of diminishing returns is less relevant. But if, as I suspect, we’ve borrowed these subconscious strategies for judging usefulness – both in terms of information and functionality – in online environment, our brains may not know or care about the subtle differences in environments.

The reason why we may not be that rational in the application of these strategies in online encounters is that they play out below the threshold of consciousness. We are not constantly and consciously adjusting our marginal value algorithm or quantifiably assessing the value of an information patch. No, our brains use a quicker and more heuristic method to mediate our output of effort – emotions. Frustration and anxiety tell us it’s time to move onto the next site or application. Feelings of reward and satisfaction indicate we should stay right where we are. The remarkable thing about this is that as quick and dirty as these emotional guidelines are, if you went to the trouble of rationally quantifying the potential of all possible alternatives, using a Bayesian approach, for instance, you’d probably find you ended up in pretty much the same place. These strategies, simmering below the surface of our consciousness, are pretty damn accurate!

So, to sum up this post, when judging the most useful way to get a task done, we have an evaluation cascade that happens very quickly in our brain:

  • If a very familiar task needs to be done in a stable environment, our habits will take over and it will be executed with little or no rational thought.
  • If the task is fairly familiar but requires some conscious guidance, we’ll retrieve a stored procedure and look for successful feedback as we work through it.
  • If a task is relatively new to us, we’ll forage through alternatives for the best way to do it, using evolved biological strategies to help balance risk (in terms of expended effort) against reward.

Now, to return to our original question, how does this evaluation cascade impact long and short-term user loyalty? I’ll return to this question in my next post.

Revisiting Entertainment vs Usefulness

brain-cogsSome time ago, I did an extensive series of posts on the psychology of entertainment. My original goal, however, was to compare entertainment and usefulness in how effective they were in engendering long-term loyalty. How do our brains process both? And, to return to my original intent, in that first post almost 4 years ago, how does this impact digital trends and their staying power?

My goal is to find out why some types of entertainment have more staying power than other types. And then, once we discover the psychological underpinnings of entertainment, lets look at how that applies to some of the digital trends I disparaged: things like social networks, micro-blogging, mobile apps and online video. What role does entertainment play in online loyalty? How does it overlap with usefulness? How can digital entertainment fads survive the novelty curse and jump the chasm to a mainstream trends with legs?

In the previous set of posts, I explored the psychology of entertainment extensively, ending up with a discussion of the evolutionary purpose of entertainment. My conclusion was that entertainment lived more in the phenotype than the genotype. To save you going back to that post, I’ll quickly summarize here: the genotype refers to traits actually encoded in our genes through evolution – the hardwired blueprint of our DNA. The phenotype is the “shadow” of these genes – behaviors caused by our genetic blueprints. Genotypes are directly honed by evolution for adaptability and gene survival. Phenotypes are by-products of this process and may confer no evolutionary advantage. Our taste for high-fat foods lives in the genotype – the explosion of obesity in our society lives in the phenotype.

This brings us to the difference between entertainment and usefulness – usefulness relies on mechanisms that predominately live in the genotype.  In the most general terms, it’s the stuff we have to do to get through the day. And to understand how we approach these things on our to-do list, it’s important to understand the difference between autotelic and exotelic activities.

Autotelic activities are the things we do for the sheer pleasure of it. The activity is it’s own reward. The word autotelic is Greek for “self + goal” – or “having a purpose in and not apart from itself.” We look forward to doing autotelic things. All things that we find entertaining are autotelic by nature.

Exotelic activities are simply a necessary means to an end. They have no value in and of themselves.  They’re simply tasks – stuff on our to do list.

The brain, when approaching these two types of activities, treats them very differently. Autotelic activities fire our reward center – the nucleus accumbens. They come with a corresponding hit of dopamine, building repetitive patterns. We look forward to them because of the anticipation of the reward. They typically also engage the prefrontal medial cortex, orchestrating complex cognitive behaviors and helping define our sense of self. When we engage in an autotelic activity, there’s a lot happening in our skulls.

Exotelic activities tend to flip the brain onto its energy saving mode. Because there is little or no neurological reward in these types of activities (other than a sense of relief once they’re done) they tend to rely on the brain’s ability to store and retrieve procedures. With enough repetition, they often become habits, skipping the brain’s rational loop altogether.

In the next post, we’ll look at how the brain tends to process exotelic activities, as it provides some clues about the loyalty building abilities of useful sites or tools. We’ll also look at what happens when something is both exotelic and autotelic.

Our Indelible Lives

First published June 3, 2010 in Mediapost’s Search Insider

It’s been a fascinating week for me. First, it was off to lovely Muncie, Ind. to meet with the group at the Center for Media Design at Ball State University. Then, it was to Chicago for the National Business Marketing Association Conference, where I was fortunate enough to be on a panel about what the B2B marketplace might look like in the near future. There was plenty of column fodder from both visits, but this week, I’ll give the nod to Ball State, simply because that visit came first.

Our Digital Footprints

Mike Bloxham, Michelle Prieb and Jen Milks (the last two joined us for our most recent Search Insider Summit) were gracious hosts, and, as with last week (when I was in Germany) I had the chance to participate in a truly fascinating conversation that I wanted to share with you. We talked about the fact that this generation will be the first to leave a permanent digital footprint. Mike Bloxham called it the Indelible Generation. That title is more than just a bon mot (being British, Mike is prone to pithy observations) — it’s a telling comment about a fundament aspect of our new society.

Imagine some far-in-the-future anthropologist recreating our culture. Up to this point in our history, the recorded narrative of any society came from a small sliver of the population. Only the wealthiest or most learned received the honor of being chronicled in any way. Average folks spent their time on this planet with nary a whisper of their lives recorded for posterity. They passed on without leaving a footprint.

Explicit and Implicit Content Creation

But today — or if not today, certainly tomorrow — all of us will leave behind a rather large digital footprint. We will leave in our wake emails, tweets, blog posts and Facebook pages. And that’s just the content we knowingly create. There’s a lot of data generated by each of us that’s simply a byproduct of our online activities and intentions. Consider, for example, our search history. Search is a unique online beast because it tends to be the thread we use to stitch together our digital lives. Each of us leaves a narrative written in search interactions that provides a frighteningly revealing glimpse into our fleeting interests, needs and passions.

 Of course, not all this data gets permanently recorded. Privacy concerns mean that search logs, for example, get scrubbed at regular intervals. But even with all that, we leave behind more data about who we were, what we cared about and what thoughts passed through our minds than any previous generation. Whether it’s personally identifiable or aggregated and anonymized, we will all leave behind footprints.

 Privacy? What Privacy?

Currently we’re struggling with this paradigm shift and its implications for our privacy. I believe in time — not that much time — we’ll simply grow to accept this archiving of our lives as the new normal, and won’t give it a second thought. We will trade personal information in return for new abilities, opportunities and entertainment. We will grow more comfortable with being the Indelible Generation.

Of course, I could be wrong. Perhaps we’ll trigger a revolt against the surrender of our secrets. Either way, we live in a new world, one where we’re always being watched. The story of how we deal with that fact is still to be written.

The Psychology of Entertainment: Our Need for Entertainment

Anytime we talk about human behavior thats triggered by the equipment we all ship with – namely our brains-we have to account for variations in how that equipment operates. We are not turned out by assembly line, with quality control measures insuring that all brains are identical. Each brain is distinct, formed both by our own genetic signature and by our environment. While variation across the human genome is remarkably minor, we are all products of bespoke design – handcrafted to make us uniquely us.

Distribution of Our Uniqueness

Snv
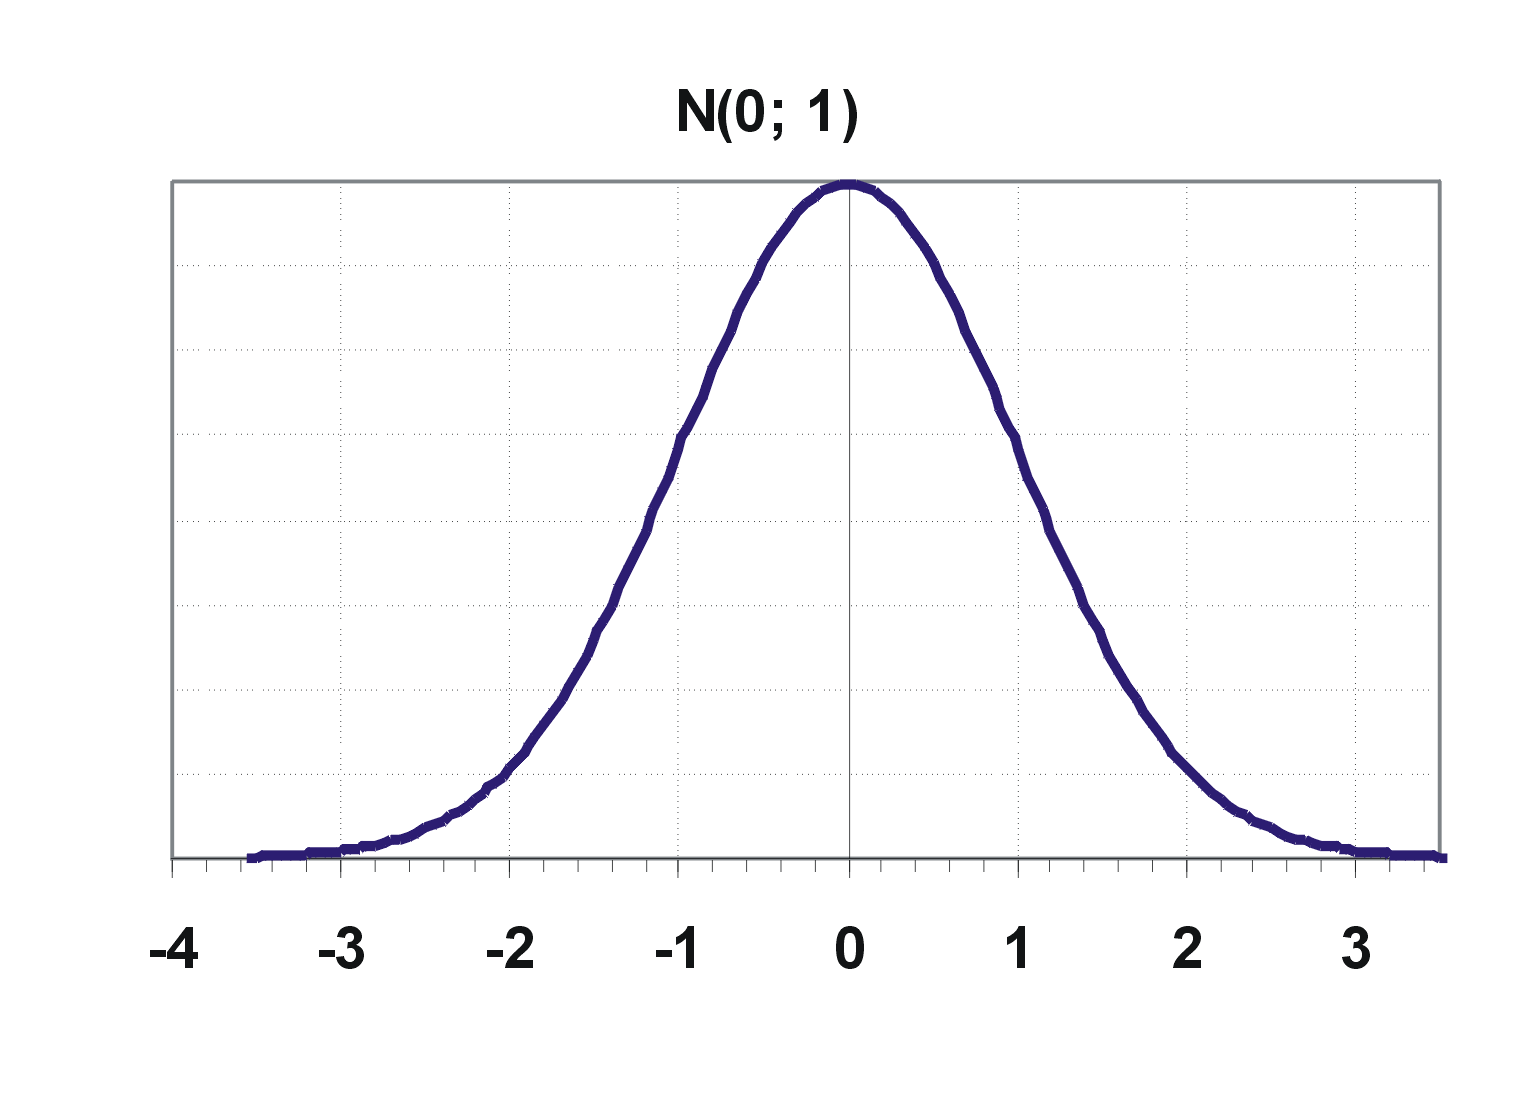
This variation typically plays out in a normal distribution curve, more commonly known as a bell curve. Most of us cluster towards the center – the norm. And as we move out from the center, venturing one or two standard deviations from the norm into outlier territory, our numbers drop dramatically.

If we talk about the phenomenon of entertainment, we are definitely talking about how our brains operate. This means that we could expect to find a normal distribution in attitudes towards entertainment, with a peak in the middle and rapidly descending slopes on both sides. For example, one would expect such a distribution in the types of entertainment we prefer: the books we read, the shows we watch, the music we listen to. in fact, with a little statistical origami, we can do a quick check on this. Take a standard distribution curve and fold it in half along the “norm” line (shown as 0). The shape should look familiar. We have Chris Anderson’s Long Tail. The similarity of tastes close to the norm accounts for blockbusters and best sellers. These are the forms of entertainment that appeal to the greatest number of individuals. More esoteric entertainment tastes live well down the curve, in outlier territory.

Long_Tail

The Need for Entertainment Scale

I’ll come back to the types of entertainment we prefer and why in a later post. Today, I want to concentrate on another variable in the human psyche that also can impact our engagement with entertainment: how much do we need to be entertained? Why are some of us drawn more to fiction and others to non-fiction. Why do some of us like the escapism of a TV sitcom and others prefer to watch the news? Why do some of us have 5 TV’s in our house, with hundreds of digital channels, and others have none? What does the normal distribution curve of our need for entertainment look like. That was exactly the question that Timothy Brock and Stephen Livingston from Ohio State University tackled (The Psychology of Entertainment Media: Blurring the Lines between Entertainment and Persuasion. Publisher: Lawrence Erlbaum Associates. Place of Publication: Mahwah, NJ. Publication Year: 2004. p 255-268).

The need for entertainment seems to be almost addictive in some cases. In the study, Brock and Livingston restrict their definition of entertainment to passive consumption of some form of entertainment, either TV, radio, film, print, theatre or sport spectacles. Of these, television is the most common, so many of the measures revolved around our relationship with that specific entertainment medium. I’ve talked before about the impact of TV on society, but some of the empirical research on our reliance on the tube is astounding. In 2002, Robert Kubey and Mihaly Csikszentmihalyi found troubling evidence of a true biological addiction to TV:

“To track behavior and emotion in the normal course of life, as opposed to the artificial conditions of the lab, we have used the Experience Sampling Method (ESM). Participants carried a beeper, and we signaled them six to eight times a day, at random, over the period of a week; whenever they heard the beep, they wrote down what they were doing and how they were feeling using a standardized scorecard.

“As one might expect, people who were watching TV when we beeped them reported feeling relaxed and passive.

“What is more surprising is that the sense of relaxation ends when the set is turned off, but the feelings of passivity and lowered alertness continue. Survey participants commonly reflect that television has somehow absorbed or sucked out their energy, leaving them depleted. They say they have more difficulty concentrating after viewing than before. In contrast, they rarely indicate such difficulty after reading. After playing sports or engaging in hobbies, people report improvements in mood. After watching TV, people’s moods are about the same or worse than before.

“Thus, the irony of TV: people watch a great deal longer than they plan to, even though prolonged viewing is less rewarding. In our ESM studies the longer people sat in front of the set, the less satisfaction they said they derived from it. When signaled, heavy viewers (those who consistently watch more than four hours a day) tended to report on their ESM sheets that they enjoy TV less than light viewers did (less than two hours a day).

What value do we place on the ability to watch TV? Brock and Livingston gave 115 undergrads two scenarios. In the first, they could correct a hypothetical mix up in their official state citizenship in return for a one time cash gift. The undergrads were asked to put a value on changing their official allegiance from one state to another. 15% would do it for free and another 40% would do it for under $1000.

The next scenario asked the students what compensation they would require to give up TV for the rest of their lives. A permanent tracking implant in their ear would notify a monitoring service if they cheated and the entire gift would be forfeited. 8% were willing to do it for free, but over 60% would need at least a million dollars to give up TV forever.

Findings: Men Need More Entertainment & The More You Think , The Less You Need to Be Entertained

In their scale of the need for entertainment, Brock and Livingston assessed three factors: Drive (how actively do you pursue passive entertainment?), Utility (how useful is passive entertainment, both to you specifically and in general?) and Passivity (how active do you like your entertainment to be?).

So, how do we fare on our need to be entertained, based on Brock and Livingston’s scale? First of all, men seem to have a stronger drive to be entertained than women. Males scored higher on the amount they spend on entertainment, the daily need for entertainment and the inability to function without entertainment. One would assume that the “couch potato curve” would skew to the male side of the demographic split.

Also interestingly, Brock and Livingston found an inverse relationship between the need to be entertained and the “need for cognition” – a measure of how much people like active problem solving and critical thinking. Again, the more you think, the less reliant you are on TV.

In a follow up study, Brock and Livingston tried to draw a defining line between entertainment (in their definition, passive consumption) and sensation seeking. I’ll touch on this in tomorrow’s post.

How Our Brains “Google”

So far this week, I’ve covered how our brains find Waldo, scan a webpage and engage with online advertising. Today, I’m looking at how our brains help find the best result on a search engine.

Searching by Habit

First, let’s accept the fact that most of us have now had a fair amount of experience searching for things on the internet, to the point that we’ve now made Google a verb. What’s more important, from a neural perspective, is that searching is now driven by habit. And that has some significant implications for how our brain works.

Habits form when we do the same thing over and over again. In order for that to happen, we need what’s called a stable environment. Whatever we’re doing, habits only form when the path each time is similar enough that we don’t have to think about each individual junction and intersection. If you drive the same way home from work each day, your brain will start navigating by habit. If you take a different route every single day, you’ll be required to think through each and every trip. Parts of the brain called the basal ganglia seem to be essential in recording these habitual scripts, acting as sort of a control mechanism telling the brain when it’s okay to run on autopilot and when it needs to wake up and pay attention. Ann Graybiel from MIT has done extensive work exploring habitual behaviors and the role of the basal ganglia.

The Stability of the Search Page

A search results page, at least for now, provides such a stable environment. Earlier this week, I looked at how our brain navigates webpages. Even though each website is unique, there are some elements that are stable enough to allow for habitual conditioned routines to form. The main logo or brand identifier is usually in the upper left. The navigation bar typically runs horizontally below the logo. A secondary navigation bar is typically found running down the left side. The right side is usually reserved for a feature sidebar or, in the case of a portal, advertising. Given these commonalities, there is enough stability in most website’s designs that we navigate for the first few seconds on autopilot.

Compared to a website, a search engine results page is rigidly structured, providing the ideal stable environment for habits to form. This has meant a surprising degree of uniformity in people’s search behaviors. My company, Enquiro, has been looking at search behavior for almost a decade now and we’ve found that it’s remained remarkably consistent. We start in the upper left, break off a “chunk” of 3 to 5 results and scan it in an “F” shaped pattern. The following excerpts from The BuyerSphere Project give a more detailed walk through of the process.

searchheatmap11 – First, we orient ourselves to the page. This is something we do by habit, based on where we expect to see the most relevant result. We use a visual anchor point, typically the blue border that runs above the search results, and use this to start our scanning in the upper left, a conditioned response we’ve called the Google Effect. Google has taught us that the highest relevance is in the upper left corner

Searchheatmap22 – Then, we begin searching for information scent. This is a term from information foraging theory, which we’ve covered in our eye tracking white papers. In this particular case, we’ve asked our participants to look for thin, light laptops for their sales team. Notice how the eye tracking hot spots are over the words that offer the greatest “scent”, based on the intention of the user. Typically, this search for scent is a scanning of the first few words of the title of the top 3 or 4 listings.

Searchheatmap33 – Now the evaluation begins. Based on the initial scan of the beginnings of titles from the top 3 or 4 listings, users begin to compare the degree of relevance of some alternatives, typically by comparing two at a time. We tend to “chunk” the results page into sections of 3 or 4 listings at a time to compare, as this has been shown to be a typical limit of working memory9 when considering search listing alternatives

searchheatmap44 -It’s this scanning pattern, roughly in the shape of an “F”, that creates the distinct scan pattern that we first called the “Golden Triangle” in our first eye tracking study. Users generally scan vertically first, creating the upright of the “F”, then horizontally when they pick up a relevant visual cue, creating the arms of the F. Scanning tends to be top heavy, with more horizontal scanning on top entries, which over time creates the triangle shape.


searchheatmap5(2)5 – Often, especially if the results are relevant, this initial scan of the first 3 or 4 listings will result in a click. If two listings or more listings in the initial set look to be relevant, the user will click through to both and compare the information scent on the landing page. This back and forth clicking is referred to as “pogo sticking”. It’s this initial set of results that represents the prime real estate on the page.

searchheatmap66 – If the initial set doesn’t result in a successful click through, the user continues to “chunk” the page for future consideration. The next chunk could be the next set of organic results, or the ads on the right hand side of the page. There, the same F Shaped Scan patterns will be repeated. By the way, there’s one thing to note about the right hand ads. Users tend to glance at the first ad and make a quick evaluation of the relevance. If the first ad doesn’t appear relevant, the user will often not scan any further, passing judgement on the usefulness and relevance of all the ads on the right side based on their impression of the ad on top.

So, that explains how habits dictate our scanning pattern. What I want to talk more about today is how our attention focusing mechanism might impact our search for information scent on the page.

The Role of the Query in Information Scent

Remember the role of our neuronal chorus, firing in unison, in drawing our attention to potential targets in our total field of vision. Now, text based web pages don’t exactly offer a varied buffet of stimuli, but I suspect the role of key words in the text of listings might serve to help focus our attention.

In a previous post, I mentioned that words are basically abstract visual representations of ideas or concepts. The shape of the letters in a familiar word can draw our attention. It tends to “pop out” at us from the rest of the words on the page. I suspect this “pop out” effect could be the result of Dr. Desimone’s neural synchrony patterns. We may have groups of neurons tuned to pick certain words out of the sea of text we see on a search page.

The Query as a Picture

This treating of a word as a picture rather than text has interesting implications for the work our brain has to do. The interpretation of text actually calls a significant number of neural mechanisms into play. It’s fairly intensive processing. We have to visually intrepret the letters, run it through the language centres of our brain, translate into a concept and only then can we capture the meaning of the word. It happens quickly, but not nearly as quickly as the brain can absorb a picture. Pictures don’t have to be interpreted. Our understanding of a picture requires fewer mental “middle men” in our brain, so it takes a shorter path. Perhaps that’s why one picture is worth a thousand words.

But in the case of logos and very well known words, we may be able to skip some of the language processing we would normally have to do. The shape of the word might be so familiar, we treat it more like an icon or picture than a word. For example, if you see your name in print, it tends to immediately jump out at you. I suspect the shape of the word might be so familiar that our brain processes it through a quicker path than a typical word. We process it as a picture rather than language.

Now, if this is the case, the most obvious candidate for this “express processing” behavior would be the actual query we use. And we have a “picture” of what the word looks like already in our minds, because we just typed it into the query box. This would mean that this word would pop out of the rest of the text quicker than other text. And, through eye tracking, there are very strong indications that this is exactly what’s happening. The query used almost inevitably attracts foveal attention quicker than anything else. The search engines have learned to reinforce this “pop out” effect by using hit bolding to put the query words in bold type when ever they appear in the results set.

Do Other Words Act as Scent Pictures?

If this is true of the query, are there other words that trigger the same pop out effect? I suspect this to also be true. We’ve seen that certain word attract more than their fair share of attention, depending on the intent of the user. Well know brands typically attract foveal attention. So do prices and salient product features. Remember, we don’t read search listings, we scan them. We focus on a few key words and if there is a strong enough match of information scent to our intent, we click on the listing.

The Intrusion of Graphics

Until recently, the average search page was devoid of graphics. But all the engines are now introducing richer visuals into many results sets. A few years ago we did some eye tracking to see what the impact might be. The impact, as we found out, was that the introduction of a graphic significantly changed the conditioned scan patterns I described earlier in the post.

eshapedpatternThis seems to be a perfect illustration of Desimone’s attention focusing mechanism at work. If we’re searching for Harry Potter, or in the case of the example heat map shown below, an iPhone, we likely have a visual image already in mind. If a relevant image appears on the page, it hits our attention alarms with full force. First of all, it stands out from the text that surrounds it. Secondly, our pre-tuned neurons immediately pick it out in our peripheral vision as something worthy of foveal focus because it matches the picture we have in our mind. And thirdly, our brain interprets the relevancy of the image much faster than it can the surrounding text. It’s an easier path for the attention mechanisms of our brain to go down and our brains follow the same rules as my sister-in-law: no unnecessary trips.

The result? The F Shaped Scan pattern, which is the most efficient scan pattern for an ordered set of text results, suddenly becomes an E shaped pattern. The center of the E is on the image, which immediately draws our attention. We scan the title beside it to confirm relevancy, and then we have a choice to make. Do we scan the section above or below. Again, our peripheral vision helps make this decision by scanning for information scent above and below the image. Words that “pop out” could lure us up or down. Typically, we expect greater relevancy higher in the page, so we would move up more often than down.

Tomorrow, I’ll wrap up my series of posts on how our brains control what grabs our attention by looking at another study that indicates we might have a built in timer that governs our attention span and we’ll revisit the concept of the information patch, looking at how long we decide to spend “in the patch.”