The 150 Millisecond Gap: The Timing of Brand Love

A few weeks ago, I was sitting in a meeting room at Simon Fraser University, looking at two squiggly lines on a graph in a Powerpoint slide. In fact, five of us in the room were all looking at it intently. Among the five of us, there was a PhD and a handful of Masters degrees in Neurology and Psychology. I contributed nothing to this impressive collection of academic achievement. Still, there was something on the chart that fascinated me.

SI140gapimage

The chart was the result of a neuroscanning experiment we conducted with SFU and Isabel Taake and Dr. Mario Liotti last year.  We were exploring how the brain responded to brands we like, brands we don’t like and brands we could care less about. The study was an ERP (Event Related Brain Potential) study. The idea of the study was to divide up the groups, based on brands they buy and brands they don’t buy and measure their brain waves as they’re presented with pictures of the brands with an EEG scanner. After, these waves were averaged and the averages of each group were compared with each other. What we were looking for were differences between the waves. We were looking for gaps.

It turned out we found two gaps. The brain waves are measured based on time, in millisecond increments. When we initially did the study, we were looking for something called the DM effect. This effect has been shown to represent a difference in how we encode memories and how effective we are in retrieving them later. We wanted to see if well liked brands showed different levels of brain activity when it came to memory encoding than neutral or disliked brands. The answer, as it turned out, was a qualified yes. What was most interesting, however, was the difference in the brain waves we saw when people were presented pictures of  brands they love and brands they either dislike or  feel ambivalent about. There was something going on here, and it was happening in two places. The first was happening very quickly, literally in the blink of an eye. We found our first gap right around 150 milliseconds – in just over 1/10th of a second. The second gap was a little later, at about 450 milliseconds, or about half a second.

Brands = Faces?

Previous ERP work often used faces as the visual stimuli that subjects were presented with. Researchers like working with faces because the human brain is so well attuned to responding to faces. As a stimuli, they provide plenty of signal with little noise. What researchers found is that there were significant differences in how our brains processes well known faces and unknown faces. They also found differences in how we processed smiling faces and scowling faces. And the differences in processing showed up in two places, one in the 150 millisecond range and the second at about 300 – 500 milliseconds. The first gap is what neurologists call the Vertex Positive Potential. The second is called the P300. I’ll explain what each of these means in more depth in a second.

What was interesting with this study is that we were seeing the same  thing play out when we substituted familiar brands for familiar faces. Respondents were responding to brands they liked the same way they would respond to a friendly face they recognized. So, what’s the big deal about that? And why two gaps? What was the significance of the 300 milliseconds that separate the two? Well, it’s the difference between gut instinct and rational thought. What we might have been seeing, as we stared at the projector screen, was two very different parts of the brain processing the same thought, with the first setting up the second.

The Quick Loop and the Slow Loop

Neurologists, including Joseph LeDoux and Antonio Damasio, have found that as we live our lives, our brains can respond to certain people, things and situations in two different ways.

The first is the quick and dirty loop. This expressway in our brain literally rips through the ancient, more primal part of our brain – what has popularly been called the Lizard brain (neurologists and psychologists hate this term, by the way). Why? Because if we hesitate in dangerous situations, we’re dead. So, we have a hair trigger response mechanism that alerts us to danger in a blink of an eye. How quick is this response? Well, coincidentally, it’s usually measured in the 100 to 200 millisecond range. This is the VPP, the Vertex Positive Potential. It’s an emotional processing of a stimulus, an immediate assessment of threat or reward.

Previous research (Jeffreys Takumachi 1992) found that the VPP is common when we see faces but could also be found when we looked at some objects.  Some, but not all objects. What we (and by we, I mean Isabel and Dr. Liotti) did was substitute preferred and non-preferred brands for faces. And we saw the same VPP gap. Typically, this early processing is done by the amygdala (our danger detection module) and other areas of the brain including the orbitofrontal cortex.  If you look at the map of neural activity, you’ll find more frontal activity in the “Buy” group. The brain is responding emotionally to what it is seeing and it’s doing so almost instantaneously, in the blink of an eye.

Slide17

But then there’s a slower loop that feeds the signal up to our prefrontal cortex, where there’s a more deliberate processing of the signal. If the signal turns out to be non threatening, the brain damps down the alarms and returns the brain to it’s pre-alert status. Cooler heads prevail, quite literally. The time for this more circuitous path? About half a second, give or take a few milliseconds. This more deliberate evaluation represents the second gap, the P300 gap, we saw in our averaged brain waves. This is a more deliberate evaluation of the stimulus. It’s here where our reasoning brains kick in and either contradict or reinforce the early signals of the VPP gap. If it’s a smiling face, we go beyond instant recognition and start to retrieve (from memory) our concept of the person behind the face. The same is true, I suspect, for our favorite brands. The neural map here shows the difference in scalp potential activity between the “Buy” group and the “Non-Buy” group. The heat we see is the home of brand love.

Slide19

Where Brand Love Lives

In neurological research, different methods deliver different insights. The ERP methodology we used provides accurate timing, thus the discovery of the 150 and 450 ms gaps. But fMRI scanning provides accurate tracking of the exact locations of neural activity. Another study, conducted in 2004, starts to give us some clues as to exactly where brand love lives. Dr. Read Montague and a team at Baylor University staged a rather elaborate repeat of the Coke-Pepsi Challenge, but this time, people took the challenge while they were in a fMRI scanner. I’ve written before about the study if you’re interested in more detail about how they pulled it off.  Today, what I want to talk about is where in the brain brand love lives.

Coke is one of the most beloved brands in the world. It elicits strong loyalty amongst its fans, to the point where they swear it tastes much better than it’s rival – Pepsi. Well, as Montague found, if they didn’t know what they’re drinking, this isn’t really true. Even the most fervent Coke fan often choose Pepsi as their preferred drink when they didn’t know what they were drinking. But when they knew the brand they were tasting, something very interesting happened. Suddenly, other parts of the Coke fan’s brain started lighting up.

cokestudy

The hippocampus, the left parahippocampal cortex, the midbrain and the dorsolateral prefrontal cortex started lighting up. This is significant because it indicates that the brain was actually retrieving concepts and beliefs from memory (the hippocampal activity) and the retrieved concepts were being integrated into feelings of reward (the prefrontal cortical activity). The brain was enhancing the physical sensation of taste with the full strength of brand love.

So?

Perhaps we’re starting to see not only the home of brand love, but also the timing. This was why I fixated on that small gap between the squiggly lines at 150 milliseconds. It’s because this represented our immediate, visceral response to brands. Before the brain really kicks in at all, we are already passing judgement on brands. And this judgement will color everything that comes after it. It sets the stage for our subsequent brand evaluations, happening at the 450 ms gap. This is when the brain structures identified in the Baylor study start to kick in and reinforce that “blink of an eye” first impression. Brands appear to deliver a one-two punch.

We’re currently planning our follow up research for 2010. I’m not exactly sure what it will entail, but you can bet we’ll be looking much closer at those 150 and 450 ms gaps!

The Psychology of Entertainment: Men, Women and How We Process Humor

Yesterday, I talked about context and it’s impact on comedy. What makes something funny in Scotland wouldn’t necessarily be as funny in Switzerland or South Africa. If different nationalities process jokes differently, there must be other dividing lines as well, right? Yes, and the biggest one is the line that segments the sexes. Men and women have significantly different humor processing hardware. Women tend to think before laughing, monitoring the social temperature before making a judgement about what’s funny. A man’s response tends to be less deliberate, a more direct connection to our primal “humor” centres.

And it’s this divide in the senses that provides some clues on the mechanisms used to process humor. Studies have found that unless both the right and left hemispheres of the brain are fully engaged in the task of processing humor, we won’t find a joke funny. This is why you never find a joke funny if it has to be explained to you. If we use the left hemisphere (the logical side) of our brain to analyze a joke too extensively, it ceases to be humorous. The suddenness of the gap closing, the elimination of incongruity and the feeling of mastery is no longer there. You’ve taken too long a road to the punchline and the humor got lost on the way.

In humans, humor seems to be a balancing act between the left and right hemisphere. The left gets the facts in order, and the right seems to provide the synthesis that produces the humor. Neurologists have found that patients with lesions to their right hemisphere can understand the “logic” of a joke but simply won’t find any humor in it. Knowing that an interplay between the hemispheres is required to produce humor explains the differing responses from men and women when it comes to what’s funny. Women have more robust wiring between the right and left hemispheres.  The important thing, however, is that we process humor subconsciously. As I said yesterday, if we stop to think too long about a joke, it ceases to be funny.

The Difference between Slapstick and Wit

three_stoogesYesterday, I talked about what makes a baby laugh. In effect, I stripped humor down to it’s essential building blocks. But, as we get older, we get more sophisticated. We move beyond the universal foundations of humor and start to develop tastes. Some of us love Oscar Wilde. Some of us love Tyler Perry. So, what is the difference between high brow and low brow humor?

Why do we laugh when other people hurt themselves? Why was it funny when Larry slapped Moe, or poked Curly in the eyes? What kind of sick, sadistic bastards are we? The Germans even coined a word for it: Schadenfreude – which translates literally as “joy from adversity”.

There is a double punch-line to slapstick comedy. The first comes from the fact that laughter and danger live in the same parts of our brain, as I explained in yesterday’s post. We have an immediate and complex reaction to physical calamity. It surprises us, which triggers the appropriate part of the brain, which in turn responds with a double hit of fear and laughter. Which side of the dividing line we end up depends on the seriousness of the calamity. Minor bumps on the head (when they happen to others), slips, falls, knocks and bumps can all trigger laughter as an immediate response. If the damage is more seriousness, our laughter quickly turns to concern. Remember yesterday when we looked at how a 5 month old’s laughter is triggered by conquerable danger, in a playful setting? These same mechanisms stay in place throughout our lives and partially explain our response to other’s physical misfortunes. In comedy, Slapstick is stylized so that we can be certain nobody is getting hurt too badly. Facial expressions, sound effects and mock moans all signal that this is just good fun. Look at the picture of the Three Stooges I included with this post. No one could look at the expressions on those faces and make the mistake of thinking that there’s anything remotely serious about the ear twisting that’s going on. We distance the physical violence from the result of that violence. It’s the entire premise of the game show Wipeout, as well  as 85% of the clips on America’s Funniest Home Videos.

The Social Side of Humor

But there’s more to it than just a mixed up fear/laughter response. Humor depends on our social radar. It depends on how we position ourselves in our social network. This is where the Schadenfreude part of the equation plays out. We find it funny when  Wile E. Coyote falls off a cliff but we don’t when the same fate befalls the Road Runner. Why? Because Wile is the bad guy and the Road Runner is the good guy. Archetypes are important in comedy. This goes back to Aristotle’s rules for drama: bad things can happen to bad people, good things are supposed to happen to good people, but when those two get mixed up, it’s a lot less satisfying to us. Schadenfreude works best when the good/bad roles are clearly defined.

So, how do we define Schadenfreude for men vs women? This is another place where males and females diverge in their opinions of what we find funny. In men, it typically plays out in terms of physical violence. We men laugh when others get hurt. With women, it’s more often defined as a social comeuppance. Women laugh at social ostracization.

Tom Green vs Kate Hudson: Guy’s Movies & Chick Flicks

Let’s visit the 6th grade school yard at lunch time. Over in this corner we have a group of guys laughing. What are they laughing about? Chances are, it’s something to do with some type of bodily emission or various parts of the male and female anatomy and how they might interact. Guys are, on the average, predictably base about what we find funny. And much as I wish we outgrew this, a quick glance down what’s currently playing at the local Cineplex will probably prove me right.

But there, over in the other corner, is a group of girls laughing. What are they laughing about? Chances are it’s not about farting or doody. It’s more likely laughter at the expense of some poor unfortunate distant member of their social circle. Social status is a key ingredient in comedies aimed at women, usually with a romantic twist thrown in.

High Brow Humor

Do we ever rise above the limitations of our base instincts when it comes to humor? Thankfully, yes. Many of us appreciate wit for it’s own sake. So, what is it about the witty remark that we find so appealing?

Perhaps the answer can be found in how we respond to wit. A witty remark almost never elicits a belly laugh. Witty remarks cause us to smile. A chuckle is usually the most we can hope for. Belly laughs are usually reserved for more physical types of comedy. Why the difference? Let’s return to our 5 month old. Babies both smile and laugh. They laugh during rough housing and more robust play sessions. They smile when they recognize the face of their mother or a grandparent. Laughter seems to come from our danger/humor circuit. Smiling comes from a more social place in our brain. In chimpanzees, a smile signals social submission. So, what does this have to do with wit?

We admire wit. We aspire to be witty. We identify with the mental acuity that typifies a witty person. We all want to be Chandler Bing, Conan O’Brien or, in an earlier age, Dorothy Parker. Wit is a signal of social station. Again, we find that what we find funny and what we find socially desirably are inextricably linked.

Wit has truth in it; wisecracking is simply calisthenics with words. – Dorothy Parker

Now that we’ve looked at what we find funny, on the next post I’ll return to a question I started to ask: what separates a TV hit from a miss?

The Psychology of Entertainment: What We Find Funny

Did you hear the one about….

A rabbi, a priest and a prostitute walk into a bar….

Knock Knock….

A lot of decidedly unfunny academic papers have been written about what makes us laugh (the one I referred to for this post was  Robert Storey, “Comedy, Its Theorists and the Evolutionary Perspective,” Criticism 38.3 (1996), Questia – what a hoot!). Freud has his own ideas that involved a sudden release of psychic energy, sort of like a mental steam release valve. It’s a sign of the dryness of the academic world to note that there is vigorous academic debate about what we find funny.

At the risk of examining an inherent human trait that’s probably better left alone, if we’re going to look at the psychology of entertainment, we have to look at what we find funny. And to begin, let’s look at what makes a baby laugh.

Getting a Baby to Laugh

babylaughBabies get humor at a pretty early age. Most babies start laughing in their first half year of life. So, obviously, there must be some fundamental qualities of humor. In understanding what we find funny, it’s helpful to look at what makes a 5 month old baby laugh.

Think about how you get a baby to laugh. A game of Peekaboo is usually effective. Tickling and gentle rough housing can usually elicit a chuckle. A adult face zooming into close proximity while babbling verbal nonsense also seems to do the trick.

Now, if we look closely at each of these activities, we start to realize there’s a macabre and twisted underbelly to humor.

Peekaboo generally works best with the primary care givers, the parents. The closer the adult is to the baby, the more likely you’ll get  a smile or laugh. But the game basically mimics the disappearance of the person closest to the baby and then brings them back. Now you see me, now you don’t, and now you see me again.

Tickling and rough housing is a toned down mock attack. The same is true when we jam our faces into that of an infant and spout baby talk. We get them to laugh by scaring the bejesus out of them. Is it any wonder that babies seem to be balanced on the fine line between laughing and crying during most of these activities? It doesn’t take much to slip from humor to fear. As the baby gets tired or if a stranger tries the same game as the parent, you’re more likely to get tears than laughter.

The Primal Building Blocks of Humor

This starts to tell us what the primal elements of humor might be. For a baby, we take a threatening situation and down play it dramatically, letting the baby feel that it’s just play. The baby picks up signals from us that there is no real threat, leaving them free to enjoy the game.  In this benign version of toned down danger, the baby builds coping skills for the world around them. This mastery of our environments, our ability to align things with a sense what’s right and achieve congruity, continues to play a critical role in what we find humorous as we get older.

By the way, humans aren’t the only animals that laugh. Other primates, such as chimpanzees, also laugh, and there the dividing line between hostility and humor is almost non existent. The toothy grin in a primate is not too many steps removed from baring your teeth in preparation for battle. And a smile is the primates sign for submission to a superior.

This line between danger and pain is one that humans continue to ride through our lives, and some enjoy the journey more than others. Some smile and laugh like idiots on a roller coaster (myself included), others are paralyzed in fear. But the difference between the two extremes is not as far as you might think. Research seems to show that both feelings originate from the same centres of the brain and it’s our threshold for sensation stimulation that separates laughter from screaming.

The Psychology of a Joke

The jokes we find funny can tell much about us as individuals. Again, jokes rely on closing gaps of incongruity, a sudden revelation that suddenly allows a situation that highlights a discrepancy to make sense. We master the situation when we “get” the punchline, the source of the humor.

But the funniness of a joke depends on our frame of mind. What we find incongruous and the things that offer a pleasing solution to that incongruity differ from person to person. A highly religious person may be offended by a dirty joke that would be gang busters amongst a bunch of guys having a drink after work. The different view of context and competing emotions of disgust render the joke unfunny to more “upright” recipients.

This dependency on cultural context can help explain why jokes seldom translate well from culture to culture. The more the joke relies on a frame of reference steeped in the uniqueness of a culture, the less likely it will be to successfully cross borders. In 2002 a study was done to find the funniest joke in the world. The winner was:

A couple of New Jersey hunters are out in the woods when one of them falls to the ground. He doesn’t seem to be breathing, his eyes are rolled back in his head. The other guy whips out his cell phone and calls the emergency services. He gasps to the operator: “My friend is dead! What can I do?” The operator, in a calm, soothing voice, says: “Just take it easy. I can help. First, let’s make sure he’s dead.” There is a silence, then a shot is heard. The guy’s voice comes back on the line. He says: “Okay, now what?”

The classic elements of humor are all here. The initial situation, the set up, the twist and the sudden understanding of the twist, resulting in, apparently, universal laughter. Notice that the context is so broad and independent of a cultural context that anyone, anywhere, should “get it”. There is nothing culturally specific about this joke.

But now let’s look at what the winner in the US was:

A man and a friend are playing golf one day at their local golf course. One of the guys is about to chip onto the green when he sees a long funeral procession on the road next to the course. He stops in mid-swing, takes off his golf cap, closes his eyes, and bows down in prayer. His friend says: “Wow, that is the most thoughtful and touching thing I have ever seen. You truly are a kind man.” The man then replies: “Yeah, well we were married 35 years.”

The humor in this joke depends on understanding how fanatical some males are about golf, a context familiar in the US, not as familiar in Sri Lanka or Zimbabwe.

The funniest joke in Canada revealed a nastier side of our culture:

When NASA first started sending up astronauts, they quickly discovered that ballpoint pens would not work in zero gravity. To combat the problem, NASA scientists spent a decade and $12 billion to develop a pen that writes in zero gravity, upside down, underwater, on almost any surface including glass and at temperatures ranging from below freezing to 300 C. The Russians used a pencil.

Much as we Canadians love our neighbors to the south, we also love to see the U.S. get it’s comeuppance. The humor of this joke depends on a shared cultural perception of Americans “overdoing” it on the world stage. Canada’s reputation as a source of world class comedians and satirists has been honed by this love/hate relationship with the U.S. Perhaps it’s not coincidental that this same tendency has produced some of the world’s best known observers of human behavior and social peculiarities, including Malcolm Gladwell, Steven Pinker and Marshall McLuhan.

In tomorrow’s post, we’ll talk about how we process humor and why we can laugh at both Oscar Wilde and Three’s Company.

The Psychology of Entertainment: Why We Love Ross, Rachel, Chandler, Monica, Joey and Phoebe

friendsIn a post last week, I dove into the question: Why are some TV shows enduring hits, some flash-in-the-pans and some none starters?

What separates a M*A*S*H, Friends or Cheers from a Baby Bob, Mama’s Family or Veronica’s Closet (Huh..you say? Exactly my point).

The difference, according to researchers Cristel Russell, Andrew Norman, and Susan Heckler (“Chapter Fifteen People and “their” Television Shows: an Overview of Television Connectedness,” The Psychology of Entertainment Media:  Blurring the Lines between Entertainment and Persuasion, ed. L. J. Shrum. Lawrence Erlbaum Associates, 2004) is our degree of connectedness with the show. Do we take the characters and situations into our own lives? Do we build a bridge between our reality and their fantasy? The stronger the bridge, the more durable the connection will be.

Successful Sitcoms have to go beyond the “Sit”

Imagine you were in a pitch for a new sitcom. “We have 6 20-something friends in Greenwich Village who hang out at a coffee shop and talk a lot” or “we have a middle aged sports writer and his family who move across from his Italian mom and dad in Long Island.”  In a Hollywood pitch for a new sitcom, it will typically be the “sit” part that gets pitched – what’s the situation? This is where the concept tends to trump character in most premises. But situations are only of fleeting interest to us humans. Situations engage the mind in the same way a puzzle or brain teaser would. They can introduce a partial picture and our curiosity wants to resolve it to our satisfaction. We want to see how the situation turns out. By the way, this mastery of unresolved situations is the basis of the appeal of humor and drama as well. But situations don’t have “legs” when it comes to consistently engaging us. We have limited attention spans for situations. Once we resolve them, or feel that we’ve resolved them, our attention moves on. This is the way it works in the real world. Life will throw us situation after situation, often several in a day. If we lingered over each one longer than was necessary, we’d never move forward. We’d keep getting caught in situational “eddies”, separated from the main current of our lives.

It gets worse. If situations can’t be resolved in a timely manner, we grow frustrated and bored with them. Our brain starts telling us, through our emotions, that it’s time to move on. So, for a show to be successful, it has to introduce a parade of situations, just like real life would.

So, how does a show keep us engaged in between situations? What keeps us tuned in? The characters. Characters are what we connect to. Characters engage us at a completely different level than situations. Situations are an intellectual challenge. Characters create emotional bonds. We care what happens to them. And this caring, this connection, provides the emotional overtones that keep the situations consistently interesting.

Let’s look at the mother of all entertainment situations, the budding romantic relationship. This has universal appeal. We all (hopefully) experience love. And we all experience sexual attraction. This is something we can relate to. When it’s simmering between two characters we care about, it’s almost irresistible. Hollywood has tested this formula thousands of times in all different situations. They have mastered the ability to mercilessly tease us through the various stages of outright hostility but inner intrigue, unrequited love, flirtatious exploration, tentative connection, secretive romance, open declaration, romantic entanglement, betrayal, the inevitable break up, and then, the cycle can start all over again. It seems contrived because it is. But it works. I’ve just described 10 seasons of Friends. The truth is, however, that we would have never stuck it out if we didn’t care about Ross and Rachel, Chandler and Monica, Joey and Phoebe. The appeal of Friends was the appeal of the characters, not the situations.

Tomorrow, I’ll look at humor. What strikes us as funny, and why? Why is there a fine line between a baby’s laughter and tears? How can we find both Tyler Perry and Oscar Wilde funny? What part of the brain processes humor? Why is this different in men and women?

The Psychology of Entertainment: A Nation of Watchers

In Brock and Livingston’s investigations of our need for entertainment, they ran up against a problem: how do you define entertainment? In attempting to answer that question (at least for the purpose of their study), they uncovered an interesting finding that provides some troubling commentary for our society.

Watching vs. Doing: The Evolution of Entertainment

Brock and Livingston were seeking to separate passive entertainment (watching TV) from active entertainment (playing a sport). They asked study participants to further define what they meant when they used the word entertainment. In two separate groups, 3 out of 4 participants defined entertainment in it’s passive sense – sitting down to watch a TV show or movie. Now, perhaps this is just a question of semantics – the word “entertainment” and the word “activity” may seem to have different meanings for us. But there are reams of social data to show that as we have adopted more forms of passive entertainment, the most ubiquitous being television, our level of activity has steadily dropped. This, however, is not the only fall out of our addiction to TV.

Watching vs Belonging: The Erosion of Social Capital

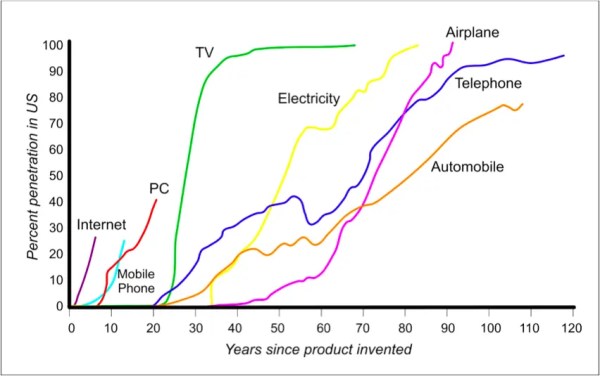
s-curve-real-lifeI’ve talked before about Robert Putnam’s book Bowling Alone, the Collapse and Revival of American Community. Putnam investigated a dramatic reversal in our desire to engage in community minded activities that occurred in the mid-60’s. These activities ran the gamut from voting and being active in PTA’s to having friends over for a card game and joining a bowling league. In chart after chart, Putnam showed how this community-mindedness peaked in the late 50’s and early 60’s and then went into a long and steady decline over the last half century. As TV invaded our front rooms, we abandoned the community hall, the voting booth and the local chapter of The Benevolent and Protective Order of Elks (one of the biggest fraternal organizations in the world). We stopped spending time with each other. Our definition of entertainment moved from the active to the passive.

This expectation to be passively entertained has spilled into other areas of our society as well. How we perceive our world may have changed from an environment we interact with to a parade that we simply sit back and watch go by. Neil Postman, in his book Amusing Ourselves to Death, speculates that as America turned from a culture revolving around the printed word to one revolving around images (especially images that jump cut from one to the other, set to a pounding aural beat, saturated with high impact stimuli like violence and sex) we have become a society of attention deficit watchers that have high expectations of being passively entertained, no matter where we are:

What I am claiming here is not that television is entertaining but that it has made entertainment itself the natural format for the representation of all experience. … The problem is not that television presents us with entertaining subject matter but that all subject matter is presented as entertaining, which is another issue altogether.

This trend shows up in our consumption of news, political issues and education. Classrooms now are not the Socratic arena of debate so much as they are a theatre, where the professor or lecturer is expected to entertain with a bag of tricks including animated Powerpoint presentations and multimedia content. Consider the difference in the campaigns of two politicians from Illinois. In 1858, debates between Abraham Lincoln and Stephen A. Douglass took 7 hours and the entire audience stayed put in the hall, their butts glued to hard wooden chairs for the entire time (the bladder control alone boggles the mind). 151 years later, we had trouble making it all the way through a 37 minute YouTube video of a Barack Obama speech.

A Different Definition of Thrill Seeking

SnvOn Monday, I talked about the normal distribution of variance in any human characteristic, typically plotted on a bell curve. Our need to seek sensation is just such a trait. Some of us are quite content to keep our pulse ticking away at a rate barely above comatose. Some of us constantly seek a massive jolt of adrenaline, always riding the ragged edge of disaster. Most of us fall somewhere in between. Marvin Zuckerman created a scale that measured our need for sensation back in 1971.
This need for sensation has an impact on the type of entertainment we seek. Historically, one would expect a strong correlation between our need for sensation and our level of activity. Traditionally, the need for sensational thrills was satisfied through participation in high adrenaline sports and activities such as rock climbing, various forms of racing and other “extreme” pursuits. The neurological loop here is fairly easy to understand. By pushing our bodies to the point where our brain decided we were in danger, our neurological defence mechanisms were duped into taking the appropriate response: a massive release of neuro-chemicals, including adrenaline, that jolted our body into a higher state of awareness and readiness. The seeking of sensation provided a natural high. On the upper end of Zuckerman’s scale, extreme sensation seeking can be clinically addictive.

But technology has thrown us a psychological curve ball when it comes to sensation seeking. There used to be a fairly well defined divide between most forms of passive entertainment and sensation seeking. The exceptions were gory spectacles such as the gladiators of ancient Rome and, in more recent times, wrestling and boxing. However, the line between the two has become more and more blurred in the 20th century. Passive entertainment now regularly relies on unabashed tweaking of our inherent subliminal defense, retaliation and sexual modules. Modern entertainment plays directly to our animal instincts.

This is where we get an especially grim view of our future. Yesterday, I mentioned that Robert Kubey and Mihaly Csikszentmihalyi found evidence that TV was addictive, in the true biological sense of addiction. Sensation seeking also has found to be physically addictive. Are we becoming a nation of passive voyeurs that only truly become alive when we’re plugged into the entertainment grid? Suddenly, the premise of The Matrix doesn’t seem that far fetched (ironic, considering the movie series was a perfect example of sensation seeking through passive entertainment).

The modern video game raises this ambiguity between sensation seeking and passive entertainment to a new high (or low, depending on your perspective). Through lifelike graphics and the game producer’s mastery of what appeals to our baser instincts, video games now efficiently deliver high octane jolts that we used to have to get by actually doing something. What does this mash up of passive entertainment and sensation seeking mean for marketers in the future?

That, alas, is a topic for a future post.

The Psychology of Entertainment: Our Need for Entertainment

Anytime we talk about human behavior thats triggered by the equipment we all ship with – namely our brains-we have to account for variations in how that equipment operates. We are not turned out by assembly line, with quality control measures insuring that all brains are identical. Each brain is distinct, formed both by our own genetic signature and by our environment. While variation across the human genome is remarkably minor, we are all products of bespoke design – handcrafted to make us uniquely us.

Distribution of Our Uniqueness

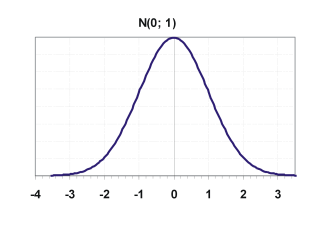
SnvThis variation typically plays out in a normal distribution curve, more commonly known as a bell curve. Most of us cluster towards the center – the norm. And as we move out from the center, venturing one or two standard deviations from the norm into outlier territory, our numbers drop dramatically.
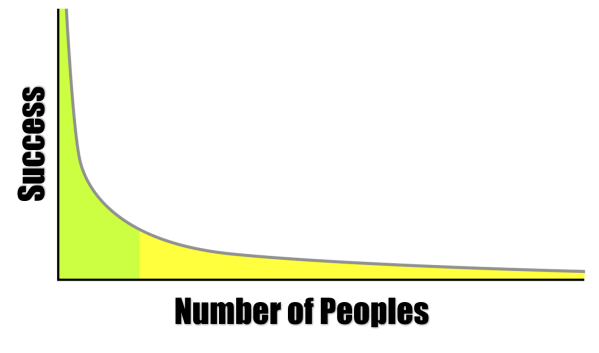
If we talk about the phenomenon of entertainment, we are definitely talking about how our brains operate. This means that we could expect to find a normal distribution in attitudes towards entertainment, with a peak in the middle and rapidly descending slopes on both sides. For example, one would expect such a distribution in the types of entertainment we prefer: the books we read, the shows we watch, the music we listen to. in fact, with a little statistical origami, we can do a quick check on this. Take a standard distribution curve and fold it in half along the “norm” line (shown as 0). The shape should look familiar. We have Chris Anderson’s Long Tail. The similarity of tastes close to the norm accounts for blockbusters and best sellers. These are the forms of entertainment that appeal to the greatest number of individuals. More esoteric entertainment tastes live well down the curve, in outlier territory.

Long_Tail

The Need for Entertainment Scale

I’ll come back to the types of entertainment we prefer and why in a later post. Today, I want to concentrate on another variable in the human psyche that also can impact our engagement with entertainment: how much do we need to be entertained? Why are some of us drawn more to fiction and others to non-fiction. Why do some of us like the escapism of a TV sitcom and others prefer to watch the news? Why do some of us have 5 TV’s in our house, with hundreds of digital channels, and others have none? What does the normal distribution curve of our need for entertainment look like. That was exactly the question that Timothy Brock and Stephen Livingston from Ohio State University tackled (The Psychology of Entertainment Media: Blurring the Lines between Entertainment and Persuasion. Publisher: Lawrence Erlbaum Associates. Place of Publication: Mahwah, NJ. Publication Year: 2004. p 255-268).

The need for entertainment seems to be almost addictive in some cases. In the study, Brock and Livingston restrict their definition of entertainment to passive consumption of some form of entertainment, either TV, radio, film, print, theatre or sport spectacles. Of these, television is the most common, so many of the measures revolved around our relationship with that specific entertainment medium. I’ve talked before about the impact of TV on society, but some of the empirical research on our reliance on the tube is astounding. In 2002, Robert Kubey and Mihaly Csikszentmihalyi found troubling evidence of a true biological addiction to TV:

“To track behavior and emotion in the normal course of life, as opposed to the artificial conditions of the lab, we have used the Experience Sampling Method (ESM). Participants carried a beeper, and we signaled them six to eight times a day, at random, over the period of a week; whenever they heard the beep, they wrote down what they were doing and how they were feeling using a standardized scorecard.

“As one might expect, people who were watching TV when we beeped them reported feeling relaxed and passive.

“What is more surprising is that the sense of relaxation ends when the set is turned off, but the feelings of passivity and lowered alertness continue. Survey participants commonly reflect that television has somehow absorbed or sucked out their energy, leaving them depleted. They say they have more difficulty concentrating after viewing than before. In contrast, they rarely indicate such difficulty after reading. After playing sports or engaging in hobbies, people report improvements in mood. After watching TV, people’s moods are about the same or worse than before.

“Thus, the irony of TV: people watch a great deal longer than they plan to, even though prolonged viewing is less rewarding. In our ESM studies the longer people sat in front of the set, the less satisfaction they said they derived from it. When signaled, heavy viewers (those who consistently watch more than four hours a day) tended to report on their ESM sheets that they enjoy TV less than light viewers did (less than two hours a day).

What value do we place on the ability to watch TV? Brock and Livingston gave 115 undergrads two scenarios. In the first, they could correct a hypothetical mix up in their official state citizenship in return for a one time cash gift. The undergrads were asked to put a value on changing their official allegiance from one state to another. 15% would do it for free and another 40% would do it for under $1000.

The next scenario asked the students what compensation they would require to give up TV for the rest of their lives. A permanent tracking implant in their ear would notify a monitoring service if they cheated and the entire gift would be forfeited. 8% were willing to do it for free, but over 60% would need at least a million dollars to give up TV forever.

Findings: Men Need More Entertainment & The More You Think , The Less You Need to Be Entertained

In their scale of the need for entertainment, Brock and Livingston assessed three factors: Drive (how actively do you pursue passive entertainment?), Utility (how useful is passive entertainment, both to you specifically and in general?) and Passivity (how active do you like your entertainment to be?).

So, how do we fare on our need to be entertained, based on Brock and Livingston’s scale? First of all, men seem to have a stronger drive to be entertained than women. Males scored higher on the amount they spend on entertainment, the daily need for entertainment and the inability to function without entertainment. One would assume that the “couch potato curve” would skew to the male side of the demographic split.

Also interestingly, Brock and Livingston found an inverse relationship between the need to be entertained and the “need for cognition” – a measure of how much people like active problem solving and critical thinking. Again, the more you think, the less reliant you are on TV.

In a follow up study, Brock and Livingston tried to draw a defining line between entertainment (in their definition, passive consumption) and sensation seeking. I’ll touch on this in tomorrow’s post.

The Psychology of Entertainment: How Our Brains Connect with Stories

Andi Bell has an amazing memory. In fact, if you shuffled together 10 decks of cards, put them in front of Andi and gave him 20 minutes, not only would he have memorized every single card in the pack, he would have memorized them in order. 520 cards, and Andi will remember every suit, every value and what order they came in. It’s a feat that boggle the everyday mind. Andi, however, has a secret. And that secret is the power of narrative. We love a good story!

As I mentioned last Friday, I want to explore the psychology of entertainment a bit more today as we explore it’s role in marketing. In a post last week, I said that audience patterns have to establish some stability before we can effectively market to them. We have become a society of early adopters, or, at least, marketers treat us as such. Because we are continually rushing from bright shiny object to bright shiny object there is tremendous churn in most online audiences. I called it “chasing Digital Fluff”.

Keeping Your Audience in One Place

But what could create the audience stability I’m talking about? I put forward usefulness as one element. In a comment, Lance Loveday also suggested entertainment value. I found this intriguing, but of course, Lance’s suggestion also raised a number of  questions for me. What represents “staying power” in entertainment? Why are some entertainment channels fads and some long enduring trends? How do our brains respond to entertainment? What is the difference between a TV show and a video game, for instance? What is it about entertainment that makes it so…well…entertaining? And finally, is Lance right? Will the entertainment factor be enough to move some digital channels from fad to trend? And, if so, where should we place our (or more correctly, our client’s) bets?

Today, I want to begin by exploring how we respond to what seems to be the oldest form of entertainment in the world: stories. We humans have a deeply wired connection with stories. I suspect that as soon as humans began communicating, we began telling stories. In fact, stories are so important to us, it appears that we have a special channel in our brains to interpret stories – evolution has equipped us with a specialized story processor. And it’s this story processor that Andi Bell uses to memorize 10 packs of cards. Bell discovered the power of the story processor, what he calls the Linking Technique, and it made him the three time World Memory Champ.

How to Memorize 520 Playing Cards – Tell 1 Story

The human mind never evolved to deal effectively with random facts. Our brain does not deal that well with the abstract. That’s why we invented writing, symbols, alphabets and math. These are the ways we take the non-concrete and manipulate them for our use. The world of our ancestors tends to play out in much less abstract terms: Where is food? Where is water? What happens when I sleep too close to predators? What happens when I steal my neighbor’s dinner? What happens when I overstep the boundary between my tribe and the neighboring tribe?

These were the realities of our ancestor’s lives and, as such, our brain evolved native mechanisms for dealing with these realities. The ability of our brains to navigate through an physical environment or to remember parables (which are nothing more than behavioral reinforcing stories) is highly developed. But in this world, our evolutionary environment, the abstract mechanisms we take for granted may be completely absent. For example, many primitive tribes have no numbering systems, or, if they do, they may be limited to three words: one, two and many. We can remember how to navigate through hundreds of places we’ve been before, or we can remember the important details of thousands of stories, but remembering a phone number consisting of just 7 or 10 digits can be a challenge. It’s not because we’re addle minded, it’s just because our brains use different mechanisms.

Andi Bell discovered this and found a way to link the abstract to the more highly evolved memory modules of our brains: our on-board navigation computer and our capacity for remembering a story.  Bell’s technique is fairly simple. In his mind, he has a standard route imagined through his home town of London, England. He’s memorized the route in detail. That’s the first step. The second step is to create a story that plays out along the route. Here, he takes each card in a standard deck of cards and creates an imaginary stand-in for it. He replaces abstract numbers and symbols with concrete images from the real world. The 8 of clubs could become a brown bear. The 3 of diamonds could become a pineapple. These become the “characters” of a story imagined on the fly. 520 random cards becomes 520 elements in a story spread through the streets of London. To recall all the cards, Andi has to follow the route through London, retelling the story as he goes. Bell’s technique is not new. It’s called the Method of Ioci, otherwise known as the Memory Palace, and was used by the ancient Greeks and Romans.

Why do stories seem to have a more direct path to our memory? What is it about the power of a story that’s so compelling to humans? Whatever it is, Malcolm Gladwell is a master of the power of a story and it’s kept him on top of the best seller list for several years now.

Gladwell’s Secret for Writing Bestsellers

Writing non-fiction is a challenge. It almost always involves the writer getting a bunch of facts or opinions from their head onto paper. That in itself is not a challenge. But getting facts into a form that is compelling to read is. But at least with facts, the writer can choose interesting ones. Opinions offer even more of a challenge. We are naturally suspicious of other people’s opinions. They have to pass through the filter of what we ourselves believe in. So how does the non-fiction writer take this unwieldy bucket of fact and opinion and craft it into something that someone else will want to read? How do you write a non-fiction best seller?  With half a million books published every year (and that’s just the ones we can keep track of), there is an extraordinarily long tail in book selling.  The 100 best selling non fiction books of 2009 represents just .02% of all books published, yet represent a huge chunk of the revenue. If there is a magic formula to making this list, Malcolm Gladwell seems to have found it. Right now, Gladwell has 2 of the 15 top selling non fiction books on the New York Times best seller list – Outliers and What the Dog Saw. Gladwell’s Blink and The Tipping Point were perpetually on top of best seller lists for the better part of the last decade. So, what’s Gladwell’s formula?

Like Andi Bell, Gladwell has discovered the power of narrative and it’s appeal to humans. Malcolm Gladwell collects social observations, both through his experiences and that of his network of friends. When he uncovers a compelling question, he first goes to his collection of observations and then, with a journalists instincts, he uncovers the stories behind the observations and tells these stories with a lucid, clear style. He lets his stories make his point for him, rather than pad his narrative with reams of opinionated rhetoric. Gladwell’s style is irresistibly compelling, making him the most successful non-fiction writer of the last decade.

How We Process a Story

So, why is a story so much more compelling than facts that are simply strung together. Why does Gladwell go to the trouble of finding the stories to illustrate his questions, essentially creating a scientific and sociological “whodunnit” (and in this case, the answer to who is always the same – we did it)? Well, for one thing, the basic premise of any Gladwell book could probably be told in 500 words if all the stories were stripped away. But then, no one would read those 500 words, would they? And additionally, stories make things stick in our brains. We are more accepting of a story and we remember it better. As with memory, our brains were built to accept stories.

There is empirical evidence (Prentice and Gerrig, 1999) that we process narrative differently than we do simple factual rhetoric. Narrative slips in through a different window, one more aligned with the physical world around us. We imagine ourselves experiencing the story. There are concrete hooks in our mind that we can hang the story on, making it more relevant to us. We become engaged with characters in the story. Gladwell wisely adds a generous helping of personal detail about the central characters in his story, as in his compelling description of Lois Weisberg in the Tipping Point :

loisLois (everyone calls her Lois) is invariably smoking a cigarette and drinking one of her dozen or so daily cups of coffee. She will have been up until two or three the previous morning, and up again at seven or seven-thirty, because she hardly seems to sleep. In some accounts — particularly if the meeting took place in the winter — she’ll be wearing her white, fur-topped Dr. Zhivago boots with gold tights; but she may have on her platform tennis shoes, or the leather jacket with the little studs on it, or maybe an outrageous piece of costume jewelry, and, always, those huge, rhinestone-studded glasses that make her big eyes look positively enormous.

Gladwell has conjured an image of Lois in our minds. To make his point, which is that the make up of most social networks include hyper connected hubs like Weisberg, Gladwell invests hundreds of words in creating a vivid profile of her. Why? Because it makes it more real to us. It turns a simple observation – our networks contain super connected hubs – into a story that engages us at a totally different level. We drop our rational guard and allow ourselves to become part of the story. In doing so, he avoids that trap that keeps most non-fiction off the best seller list – he knows that best way to inform is to entertain.

So, we’ve learned that entertainment works best when it slips past our rational processing mechanisms and hits a more concrete, ancient part of our brain. There needs to be ease of access by respecting what our brains were built to do. Tomorrow, I’ll pick the thread up again when I continue to look at the psychology of entertainment.

How Our Brain Decides How Long We Look at Something

In this week, I’ve talked about how our attention focusing mechanism moves the spotlight of foveal attention around different environments: a Where’s Waldo picture, a webpage, a website with advertising and a search engine results page. I want to wrap up the week by looking at another study that looked at the role of brain waves in regulating how we shift the spotlight of attention from one subject to another.

Eye Spy

eyetrackingsaccadesIf you do eye tracking research, you soon learn to distinguish fixations and saccades. Fixations occur when we let our foveal attention linger on an element, even for a fraction of a second. Saccades are the movements our eyes make from one fixation to the next. These movements take mere milliseconds. Below I show an example of a single session “gaze plot” – the recording of how one individual’s eyes took in an ad (the image is from Tobii, the maker of the eye tracking equipment we use). The dots represent fixations, as measured in milliseconds. The bigger the dot the longer the eye stayed here. The lines connecting the dots are saccades.

When you look at a scene like the one shown here, the question becomes, how do you consciously move from one element to another. It’s not like you think “okay, I’ve spent enough time looking at the logo, perhaps it’s time to move to the headline of the ad, or the rather attractive bosom in the upper right corner (I suspect the participant was male)” The movements happen subconsciously. Your eyes move to digest the content of the picture on their own accord, based on what appears to be interesting based on your overall scan of the picture and your attention focusing mechanisms.

Keeping Our Eyes Running on Time

Knowing that the eye tends to move from spot to spot subconsciously, Dr. Earl Miller at MIT decided to look closer at the timing of these shifts of attention and what might cause them. He found that our brains appear to have a built in timer that moves our eyes around a scene. Our foveal focus shifts about 25 times a second and this shift seems to be regulated by our brain waves. Our brain cycles between high activity phases and low activity phases, the activity recorded through EEG scanning. Neurologists have known that these waves seem to be involved in the focusing of attention and the functions of working memory, but Miller’s study showed a conclusive link between these wave cycles and the refocusing of visual attention. It appears our brains have a built in metronome that dictates how we engage with visual stimuli. The faster the cycles, the faster we “think.”

But, it’s not as if we let our eyes dash around the page every 1/25 of a second. Our eyes linger in certain spots and jump quickly over others. Somewhere, something is dictating how long the eye stays in one spot. As our brain waves tick out the measures of attention, something in our brains decide where to invest those measures and how many should be invested.

The Information Scent Clock is Ticking

Here, I take a huge philosophical leap and tie together two empirical bodies of knowledge with nothing scientifically concrete to connect them that I’m aware of. Let’s imagine for a second that Miller’s timing of eye movements might play some role in Eric Charnov’s Marginal Value Theorem, which in turn plays a part in Peter Pirolli’s Information Foraging Theory.

Eric Charnov discovered that animals seem to have an innate and highly accurate sense of when to leave one source of food and move on to another, based on a calculation of the energy that would have to be expended versus the calories that would be gained in return. Obviously, organisms that are highly efficient at surviving would flourish in nature, passing on their genes and less efficient candidates would die out. Charnov’s marginal value calculation would be a relatively complex one if we sat down to work it out on paper (Charnov did exactly that, with some impressive charts and formulas) but I’m guessing the birds Charnov was studying didn’t take this approach. The calculations required are done by instinct, not differential calculus.

So, if birds can do it, how do humans fare? Well, we do pretty well when it comes to food. In fact, we’re so good at seeking high calorie foods, it’s coming back to bite us. We have highly evolved tastes for high fat, high sugar calorie rich foods. In the 20th Century, this built in market preference caused food manufacturers to pump out these foods by the truck load. Now, well over 1/3 of the population is considered obese. Evolution sometimes plays nasty tricks on us, but I digress.

Pirolli took Charnov’s marginal value theorem and applied it to how we gather information in an online environment. Do we use the same instinctive calculations to determine how long to spend on a website looking for the information we’re seeking? Is our brain doing subconscious calculations the entire time we’re browsing online, telling us to either click deeper on a site or give up and go back to Google? I suspect the answer is yes. And, if that’s the case, are our brain waves that dictate how and where we spend our attention part of this calculation, a mental hourglass that somehow factors into Charnov’s theorem? If so, it behooves us to ensure our websites instill a sense of information scent as soon as possible. The second someone lands on our site, the clock is already ticking. Each tick that goes by without them finding something relevant devalues our patch according to Charnov’s theorem.

How Our Brains “Google”

So far this week, I’ve covered how our brains find Waldo, scan a webpage and engage with online advertising. Today, I’m looking at how our brains help find the best result on a search engine.

Searching by Habit

First, let’s accept the fact that most of us have now had a fair amount of experience searching for things on the internet, to the point that we’ve now made Google a verb. What’s more important, from a neural perspective, is that searching is now driven by habit. And that has some significant implications for how our brain works.

Habits form when we do the same thing over and over again. In order for that to happen, we need what’s called a stable environment. Whatever we’re doing, habits only form when the path each time is similar enough that we don’t have to think about each individual junction and intersection. If you drive the same way home from work each day, your brain will start navigating by habit. If you take a different route every single day, you’ll be required to think through each and every trip. Parts of the brain called the basal ganglia seem to be essential in recording these habitual scripts, acting as sort of a control mechanism telling the brain when it’s okay to run on autopilot and when it needs to wake up and pay attention. Ann Graybiel from MIT has done extensive work exploring habitual behaviors and the role of the basal ganglia.

The Stability of the Search Page

A search results page, at least for now, provides such a stable environment. Earlier this week, I looked at how our brain navigates webpages. Even though each website is unique, there are some elements that are stable enough to allow for habitual conditioned routines to form. The main logo or brand identifier is usually in the upper left. The navigation bar typically runs horizontally below the logo. A secondary navigation bar is typically found running down the left side. The right side is usually reserved for a feature sidebar or, in the case of a portal, advertising. Given these commonalities, there is enough stability in most website’s designs that we navigate for the first few seconds on autopilot.

Compared to a website, a search engine results page is rigidly structured, providing the ideal stable environment for habits to form. This has meant a surprising degree of uniformity in people’s search behaviors. My company, Enquiro, has been looking at search behavior for almost a decade now and we’ve found that it’s remained remarkably consistent. We start in the upper left, break off a “chunk” of 3 to 5 results and scan it in an “F” shaped pattern. The following excerpts from The BuyerSphere Project give a more detailed walk through of the process.

searchheatmap11 – First, we orient ourselves to the page. This is something we do by habit, based on where we expect to see the most relevant result. We use a visual anchor point, typically the blue border that runs above the search results, and use this to start our scanning in the upper left, a conditioned response we’ve called the Google Effect. Google has taught us that the highest relevance is in the upper left corner

Searchheatmap22 – Then, we begin searching for information scent. This is a term from information foraging theory, which we’ve covered in our eye tracking white papers. In this particular case, we’ve asked our participants to look for thin, light laptops for their sales team. Notice how the eye tracking hot spots are over the words that offer the greatest “scent”, based on the intention of the user. Typically, this search for scent is a scanning of the first few words of the title of the top 3 or 4 listings.

Searchheatmap33 – Now the evaluation begins. Based on the initial scan of the beginnings of titles from the top 3 or 4 listings, users begin to compare the degree of relevance of some alternatives, typically by comparing two at a time. We tend to “chunk” the results page into sections of 3 or 4 listings at a time to compare, as this has been shown to be a typical limit of working memory9 when considering search listing alternatives

searchheatmap44 -It’s this scanning pattern, roughly in the shape of an “F”, that creates the distinct scan pattern that we first called the “Golden Triangle” in our first eye tracking study. Users generally scan vertically first, creating the upright of the “F”, then horizontally when they pick up a relevant visual cue, creating the arms of the F. Scanning tends to be top heavy, with more horizontal scanning on top entries, which over time creates the triangle shape.


searchheatmap5(2)5 – Often, especially if the results are relevant, this initial scan of the first 3 or 4 listings will result in a click. If two listings or more listings in the initial set look to be relevant, the user will click through to both and compare the information scent on the landing page. This back and forth clicking is referred to as “pogo sticking”. It’s this initial set of results that represents the prime real estate on the page.

searchheatmap66 – If the initial set doesn’t result in a successful click through, the user continues to “chunk” the page for future consideration. The next chunk could be the next set of organic results, or the ads on the right hand side of the page. There, the same F Shaped Scan patterns will be repeated. By the way, there’s one thing to note about the right hand ads. Users tend to glance at the first ad and make a quick evaluation of the relevance. If the first ad doesn’t appear relevant, the user will often not scan any further, passing judgement on the usefulness and relevance of all the ads on the right side based on their impression of the ad on top.

So, that explains how habits dictate our scanning pattern. What I want to talk more about today is how our attention focusing mechanism might impact our search for information scent on the page.

The Role of the Query in Information Scent

Remember the role of our neuronal chorus, firing in unison, in drawing our attention to potential targets in our total field of vision. Now, text based web pages don’t exactly offer a varied buffet of stimuli, but I suspect the role of key words in the text of listings might serve to help focus our attention.

In a previous post, I mentioned that words are basically abstract visual representations of ideas or concepts. The shape of the letters in a familiar word can draw our attention. It tends to “pop out” at us from the rest of the words on the page. I suspect this “pop out” effect could be the result of Dr. Desimone’s neural synchrony patterns. We may have groups of neurons tuned to pick certain words out of the sea of text we see on a search page.

The Query as a Picture

This treating of a word as a picture rather than text has interesting implications for the work our brain has to do. The interpretation of text actually calls a significant number of neural mechanisms into play. It’s fairly intensive processing. We have to visually intrepret the letters, run it through the language centres of our brain, translate into a concept and only then can we capture the meaning of the word. It happens quickly, but not nearly as quickly as the brain can absorb a picture. Pictures don’t have to be interpreted. Our understanding of a picture requires fewer mental “middle men” in our brain, so it takes a shorter path. Perhaps that’s why one picture is worth a thousand words.

But in the case of logos and very well known words, we may be able to skip some of the language processing we would normally have to do. The shape of the word might be so familiar, we treat it more like an icon or picture than a word. For example, if you see your name in print, it tends to immediately jump out at you. I suspect the shape of the word might be so familiar that our brain processes it through a quicker path than a typical word. We process it as a picture rather than language.

Now, if this is the case, the most obvious candidate for this “express processing” behavior would be the actual query we use. And we have a “picture” of what the word looks like already in our minds, because we just typed it into the query box. This would mean that this word would pop out of the rest of the text quicker than other text. And, through eye tracking, there are very strong indications that this is exactly what’s happening. The query used almost inevitably attracts foveal attention quicker than anything else. The search engines have learned to reinforce this “pop out” effect by using hit bolding to put the query words in bold type when ever they appear in the results set.

Do Other Words Act as Scent Pictures?

If this is true of the query, are there other words that trigger the same pop out effect? I suspect this to also be true. We’ve seen that certain word attract more than their fair share of attention, depending on the intent of the user. Well know brands typically attract foveal attention. So do prices and salient product features. Remember, we don’t read search listings, we scan them. We focus on a few key words and if there is a strong enough match of information scent to our intent, we click on the listing.

The Intrusion of Graphics

Until recently, the average search page was devoid of graphics. But all the engines are now introducing richer visuals into many results sets. A few years ago we did some eye tracking to see what the impact might be. The impact, as we found out, was that the introduction of a graphic significantly changed the conditioned scan patterns I described earlier in the post.

eshapedpatternThis seems to be a perfect illustration of Desimone’s attention focusing mechanism at work. If we’re searching for Harry Potter, or in the case of the example heat map shown below, an iPhone, we likely have a visual image already in mind. If a relevant image appears on the page, it hits our attention alarms with full force. First of all, it stands out from the text that surrounds it. Secondly, our pre-tuned neurons immediately pick it out in our peripheral vision as something worthy of foveal focus because it matches the picture we have in our mind. And thirdly, our brain interprets the relevancy of the image much faster than it can the surrounding text. It’s an easier path for the attention mechanisms of our brain to go down and our brains follow the same rules as my sister-in-law: no unnecessary trips.

The result? The F Shaped Scan pattern, which is the most efficient scan pattern for an ordered set of text results, suddenly becomes an E shaped pattern. The center of the E is on the image, which immediately draws our attention. We scan the title beside it to confirm relevancy, and then we have a choice to make. Do we scan the section above or below. Again, our peripheral vision helps make this decision by scanning for information scent above and below the image. Words that “pop out” could lure us up or down. Typically, we expect greater relevancy higher in the page, so we would move up more often than down.

Tomorrow, I’ll wrap up my series of posts on how our brains control what grabs our attention by looking at another study that indicates we might have a built in timer that governs our attention span and we’ll revisit the concept of the information patch, looking at how long we decide to spend “in the patch.”

How Our Brain Scans a Webpage

eyesYesterday, I explained how our brain finds “Waldo.” To briefly recap the post:

  • We have two neural mechanisms for seeing things we might want to pay attention to: a peripheral scanning system that takes in a wide field of vision and a focused (foveal) system that allows us to drill down to details
  • We have neurons that are specialists in different areas: i.e. picking out colors, shapes and disruptions in patterns
  • We use these recruited neuronal swat teams to identify something we’re looking for in our “mind’s eye” (the visual cortex) prior to searching for it in our environment
  • These swat teams focus our attention on our intended targets by synchronizing their firing patterns (like a mental Flash Mob) which allows them to rise above the noise of the other things fighting for our attention.

Today, let’s look at the potential implications of this in our domain, specifically interactions with websites.

But First: A Word about Information Scent

I’ve talked before about Pirolli’s Information Foraging Theory (and another post from this blog). Briefly, it states that we employ the same strategies we use to find food when we’re looking for information online. That’s because, just like food, information tends to come in patches online and we have to make decisions about the promise of the patch, to determine whether we should stay there or find a new patch. There’s another study I’ve yet to share (it will be coming in a post later this week) that indicates our brain might have a built in timer that controls how much time we spend in a patch and when we decide to move on.

The important point for this post is that we have a mental image of the information we seek. We picture our “prey” in our mind before looking for it. And, if that prey can be imagined visually, this will begin to recruit our swat team of neurons to help guide us to the part of the page where we might see it. Just like we have a mental picture of Waldo (from yesterday’s post) that helps us pick him out of a crowd, we have a mental picture of whatever we’re looking for.

Pirolli talks about information scent. These are the clues on a page that the information we seek lies beyond a link or button. Now, consider what we’ve learned about how the brain chooses what we pay attention to. If a visual representation of information is relevant, it acts as a powerful presentation of information scent. The brain processes images much faster than text (which has to be translated by the brain). We would have our neuronal swat team already primed for the picture, singing in unison to draw the spotlight of our attention towards it.

Neurons Storming Your Webpage

sunscreenshotFirst, let me share some of the common behaviors we’ve seen through eye tracking on people visiting websites (in an example from The BuyerSphere Project). I’ll try to interpret what’s happening in the brain:

The heat map shows the eye activity on a mocked up home page. Remember, eye tracking only captures foveal attention, not peripheral, so we’re seeing activity after our brain has already focused the spotlight of attention. For example, notice how the big picture has almost no eye tracking “heat” on it. Most of the time, we don’t have to focus our fovea on a picture to understand what’s in it (the detail rich Waldo pictures would be the exception). Our peripheral vision is more than adequate to interpret most pictures. But consider what happens when the picture matches the target in our “mind’s eye”. The neurons draw our eye to it.

One thing to think about. Words shown in text are pictures too. I’ll be coming back to this theme a couple of times – but a word is nothing more than a picture that represents a concept. For example, the Sun logo in the upper left (1) is nothing more than a picture that our brain associates with the company Sun Microsystems. To interpret this word, the brain first has to interpret the shape of the word. That means there are neurones that recognize straight edges, others than recognize curved edges and others that look for the overall “shape” of the word. Words too can act as information targets that we picture mentally before seeing it in front of us. For example, let’s imagine that we’re a developer. The word “DEVELOPER” (2) has a shape that is recognizable to us because we’ve seen it so often. The straight strokes of the E’s and V’s, sandwiched between the curves of the D’s, O’ and P’s. As we scan the overall page, our “Developer” neurons may suddenly wake up, synchronize their firing and draw the eye here as well. “Developer” already has a prewired connection in our brains. This is true for all the words we’re most familiar with, including brands like Sun. This is why we see a lot of focused eye activity on these areas of the picture.

Intent Clustering

In the last part of today’s post, I want to talk about a concept I spent some time on in the BuyerSphere Project: Intent Clustering. I’ve always know this makes sense from an Information Scent perspective, but now I know why from a neural perspective as well.

Intent clustering is creating groups of relevant information cues in the same area of the page. For example, for a product category on an e-commerce page, an intent cluster would include a picture of the product, a headline with the product category name, short bullet points with salient features and brands and perhaps relevant logos. An Intent cluster immediately says to the visitor that this is the right path to take to find out more about a certain topic or subject. The page shown has two intent clusters that were aligned with the task we gave, one in the upper right sidebar (3) and one in the lower left hand corner (4). Again, we see heat around both these areas.

Why are intent clusters “eye candy” for visitors? It’s because we’ve stacked the odds for these clusters to be noticed peripherally in our favor. We’ve included pictures, brands, familiar words and hints of rich information scent in well chosen bullet points. This combination is almost guaranteed to set our neural swat teams singing in harmony. Once scanned in peripheral vision, the conductor (the FEF I talked about in yesterday’s post) of our brain swings our attention spotlight towards the cluster for more engaged consumption, generating the heat we see in the above heatmap.

Tomorrow, I’ll be looking at how these mechanisms can impact our engagement with online display ads.